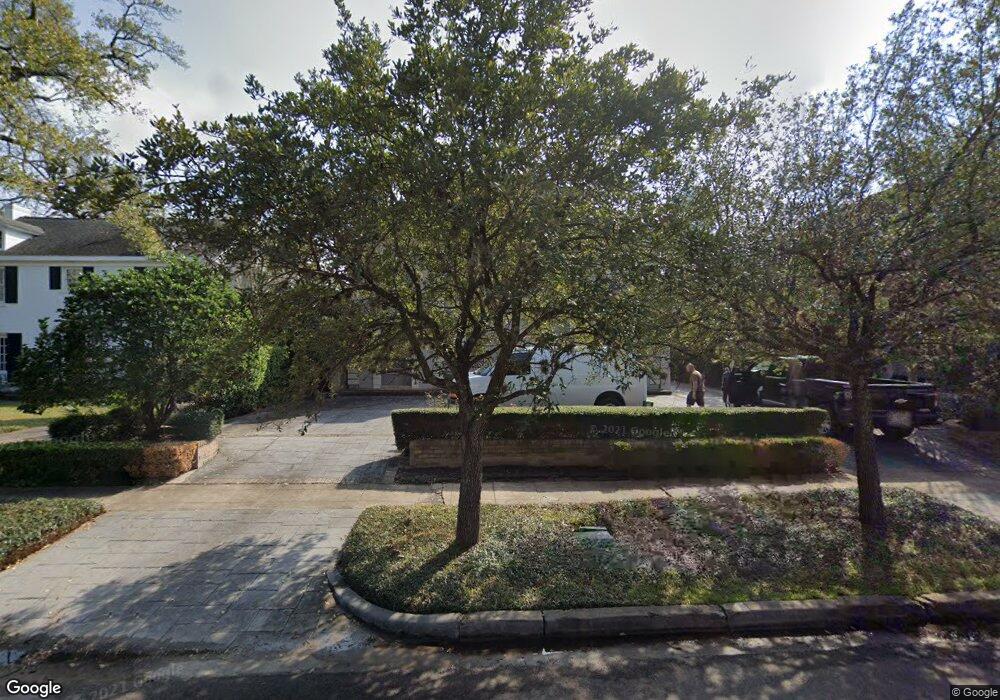
2441 Del Monte Dr Houston, TX 77019
River Oaks NeighborhoodEstimated Value: $3,833,523 - $5,215,000
5
Beds
8
Baths
7,090
Sq Ft
$638/Sq Ft
Est. Value
About This Home
This home is located at 2441 Del Monte Dr, Houston, TX 77019 and is currently estimated at $4,520,174, approximately $637 per square foot. 2441 Del Monte Dr is a home located in Harris County with nearby schools including River Oaks Elementary School, Lanier Middle School, and Lamar High School.
Ownership History
Date
Name
Owned For
Owner Type
Purchase Details
Closed on
Dec 17, 2002
Sold by
Melnick Bert and Moore Carl
Bought by
Berzin Vel and Berzin Elizabeth
Current Estimated Value
Home Financials for this Owner
Home Financials are based on the most recent Mortgage that was taken out on this home.
Original Mortgage
$500,000
Outstanding Balance
$211,836
Interest Rate
6.05%
Estimated Equity
$4,308,338
Purchase Details
Closed on
Sep 27, 1999
Sold by
Howell James F and Howell Stephanie S
Bought by
Mcdonald John E and Mcdonald Rebecca A
Purchase Details
Closed on
Jul 30, 1999
Sold by
Melnick Bert and Moore Carl
Bought by
Howell James F and Howell Stephanie S
Create a Home Valuation Report for This Property
The Home Valuation Report is an in-depth analysis detailing your home's value as well as a comparison with similar homes in the area
Home Values in the Area
Average Home Value in this Area
Purchase History
| Date | Buyer | Sale Price | Title Company |
|---|---|---|---|
| Berzin Vel | -- | Stewart Title | |
| Mcdonald John E | -- | Charter Title Company | |
| Howell James F | -- | -- |
Source: Public Records
Mortgage History
| Date | Status | Borrower | Loan Amount |
|---|---|---|---|
| Open | Berzin Vel | $500,000 |
Source: Public Records
Tax History Compared to Growth
Tax History
| Year | Tax Paid | Tax Assessment Tax Assessment Total Assessment is a certain percentage of the fair market value that is determined by local assessors to be the total taxable value of land and additions on the property. | Land | Improvement |
|---|---|---|---|---|
| 2025 | $36,098 | $3,200,000 | $1,708,245 | $1,491,755 |
| 2024 | $36,098 | $2,857,442 | $1,604,715 | $1,252,727 |
| 2023 | $36,098 | $3,066,926 | $1,552,950 | $1,513,976 |
| 2022 | $61,173 | $2,778,184 | $1,501,185 | $1,276,999 |
| 2021 | $63,133 | $2,708,811 | $1,397,655 | $1,311,156 |
| 2020 | $63,095 | $2,605,527 | $1,397,655 | $1,207,872 |
| 2019 | $72,852 | $2,879,031 | $1,397,655 | $1,481,376 |
| 2018 | $45,603 | $2,667,700 | $1,345,890 | $1,321,810 |
| 2017 | $68,836 | $2,741,061 | $1,345,890 | $1,395,171 |
| 2016 | $62,578 | $2,741,061 | $1,284,710 | $1,456,351 |
| 2015 | $40,908 | $2,249,862 | $1,238,828 | $1,011,034 |
| 2014 | $40,908 | $2,544,308 | $1,055,298 | $1,489,010 |
Source: Public Records
Map
Nearby Homes
- 2525 Inwood Dr
- 2249 Pelham Dr
- 2233 Pelham Dr
- 2413 Brentwood Dr
- 1561 Kirby Dr
- 2217 Pelham Dr
- 2323 San Felipe St Unit 901
- 2323 San Felipe St Unit 1101
- 2323 San Felipe St Unit 602
- 1913 Revere St
- 2336 Welch St
- 1915 Kirby Dr
- 2204 Inwood Dr
- 2103 Argonne St Unit B
- 1915 Spann St
- 2221 Welch St Unit 201
- 2221 Welch St Unit 401
- 2240 Mimosa Dr Unit 4W
- 2240 Mimosa Dr Unit 4N
- 2240 Mimosa Dr Unit PH-8W
- 2435 Del Monte Dr
- 2505 Del Monte Dr
- 2431 Del Monte Dr
- 2438 Pelham Dr
- 2434 Pelham Dr
- 2511 Del Monte Dr
- 2442 Pelham Dr
- 2428 Pelham Dr
- 2425 Del Monte Dr
- 2504 Pelham Dr
- 2424 Pelham Dr
- 2440 Del Monte Dr
- 2517 Del Monte Dr
- 2510 Del Monte Dr
- 2419 Del Monte Dr
- 2508 Pelham Dr
- 2418 Pelham Dr
- 2504 Del Monte Dr
- 2428 Del Monte Dr
- 2518 Del Monte Dr