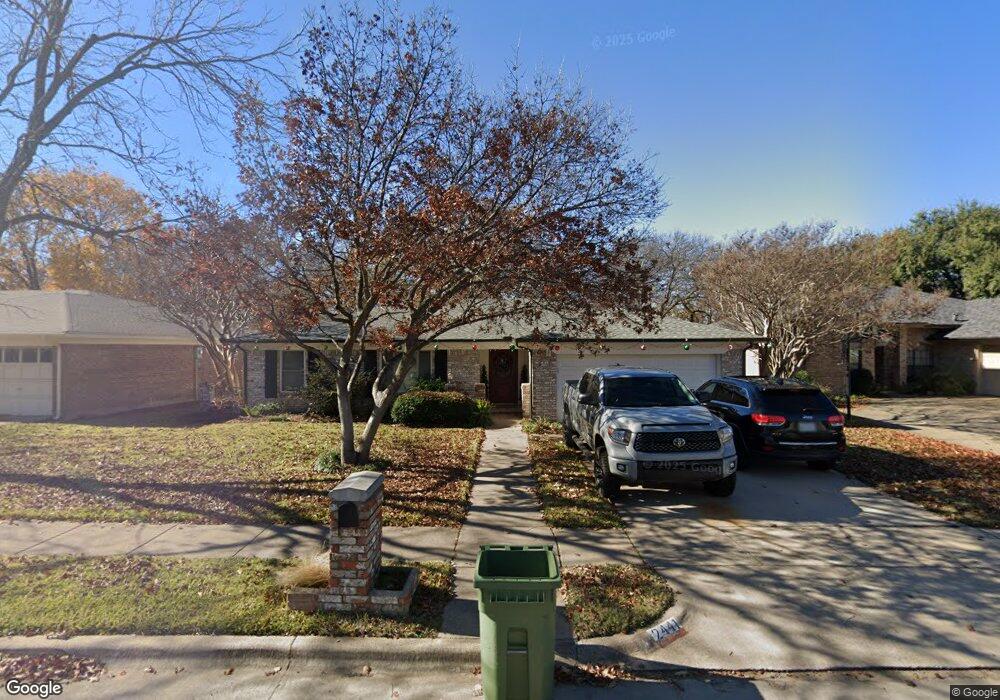
2441 Meadow Creek Bedford, TX 76021
Estimated Value: $381,054 - $444,000
3
Beds
2
Baths
1,824
Sq Ft
$223/Sq Ft
Est. Value
About This Home
This home is located at 2441 Meadow Creek, Bedford, TX 76021 and is currently estimated at $406,264, approximately $222 per square foot. 2441 Meadow Creek is a home located in Tarrant County with nearby schools including Meadow Creek Elementary School, Harwood Junior High School, and Trinity High School.
Ownership History
Date
Name
Owned For
Owner Type
Purchase Details
Closed on
May 1, 2003
Sold by
Davis Roland Martin and Davis Debbie
Bought by
Shulin James E and Shulin Lisa P
Current Estimated Value
Home Financials for this Owner
Home Financials are based on the most recent Mortgage that was taken out on this home.
Original Mortgage
$139,550
Outstanding Balance
$61,004
Interest Rate
5.87%
Mortgage Type
Purchase Money Mortgage
Estimated Equity
$345,260
Purchase Details
Closed on
May 7, 2002
Sold by
Smedstad Dan and Smedstad Cindy
Bought by
Davis Ronald Martin and Davis Debbie
Purchase Details
Closed on
Oct 29, 1997
Sold by
Davis Roland Martin and Davis Debbie
Bought by
Smedstad Dan and Smedstad Cindy
Home Financials for this Owner
Home Financials are based on the most recent Mortgage that was taken out on this home.
Original Mortgage
$100,000
Interest Rate
7.27%
Mortgage Type
Seller Take Back
Create a Home Valuation Report for This Property
The Home Valuation Report is an in-depth analysis detailing your home's value as well as a comparison with similar homes in the area
Home Values in the Area
Average Home Value in this Area
Purchase History
| Date | Buyer | Sale Price | Title Company |
|---|---|---|---|
| Shulin James E | -- | American Title Co | |
| Davis Ronald Martin | -- | -- | |
| Smedstad Dan | -- | -- |
Source: Public Records
Mortgage History
| Date | Status | Borrower | Loan Amount |
|---|---|---|---|
| Open | Shulin James E | $139,550 | |
| Previous Owner | Smedstad Dan | $100,000 |
Source: Public Records
Tax History Compared to Growth
Tax History
| Year | Tax Paid | Tax Assessment Tax Assessment Total Assessment is a certain percentage of the fair market value that is determined by local assessors to be the total taxable value of land and additions on the property. | Land | Improvement |
|---|---|---|---|---|
| 2025 | $7,238 | $371,771 | $63,750 | $308,021 |
| 2024 | $7,238 | $371,771 | $63,750 | $308,021 |
| 2023 | $6,000 | $312,815 | $42,500 | $270,315 |
| 2022 | $7,124 | $326,154 | $42,500 | $283,654 |
| 2021 | $6,458 | $274,173 | $42,500 | $231,673 |
| 2020 | $5,713 | $240,305 | $42,500 | $197,805 |
| 2019 | $6,290 | $258,905 | $42,500 | $216,405 |
| 2018 | $5,395 | $222,070 | $42,500 | $179,570 |
| 2017 | $4,851 | $200,535 | $35,000 | $165,535 |
| 2016 | $4,486 | $185,429 | $35,000 | $150,429 |
| 2015 | $3,739 | $148,900 | $18,000 | $130,900 |
| 2014 | $3,739 | $148,900 | $18,000 | $130,900 |
Source: Public Records
Map
Nearby Homes
- 2417 Meadow Ct
- 2501 Murphy Dr
- 2601 Murphy Dr
- 2516 Classic Ct W
- 2300 Folkstone Way
- 2521 Sanders Ct
- 2609 Woodson Dr
- 2909 Oakridge Dr
- 2922 Beachtree Ln
- 2700 Mimosa Ct
- 2220 Tiffany Glenn Ct
- 2109 Oakmeadow St
- 2024 Oakmeadow St
- 2616 Greenwood Ct
- 2112 Oakmeadow Place
- 2600 Willow Bend
- 3024 Highgate Ln
- 2709 Willow Bend
- 22 Lincolnshire Cir
- 3152 Woodbridge Dr
- 2445 Meadow Creek
- 2437 Meadow Creek
- 2501 Meadow Creek
- 2433 Meadow Creek
- 2521 Meadow View
- 2505 Meadow Creek
- 2444 Meadow Creek
- 2429 Meadow Creek
- 2429 Meadow Creek
- 2444 Meadow Creek
- 2440 Meadow Creek
- 2517 Meadow View
- 2524 Meadow View
- 2517 Meadow View
- 2524 Meadow View
- 2509 Meadow Creek
- 2436 Meadow Creek
- 2421 Meadow Ct
- 2432 Meadow Creek
- 2425 Meadow Ct