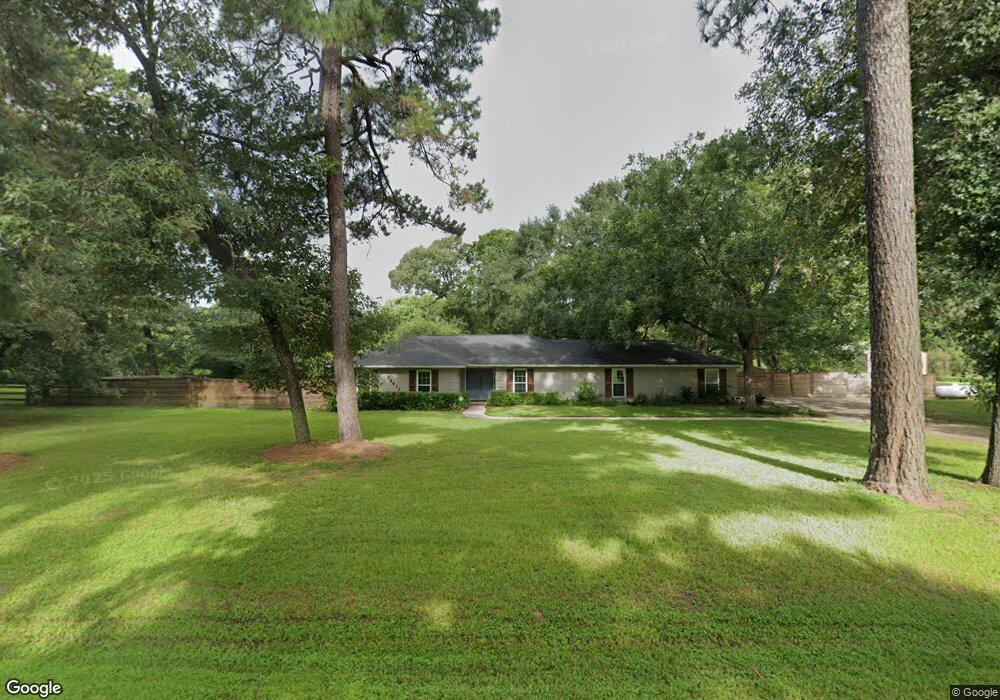
24411 Brautigam Rd Magnolia, TX 77355
Estimated Value: $383,000 - $447,000
3
Beds
2
Baths
1,924
Sq Ft
$217/Sq Ft
Est. Value
About This Home
This home is located at 24411 Brautigam Rd, Magnolia, TX 77355 and is currently estimated at $418,210, approximately $217 per square foot. 24411 Brautigam Rd is a home located in Montgomery County with nearby schools including Decker Prairie Elementary School, Tomball Intermediate School, and Tomball Junior High School.
Ownership History
Date
Name
Owned For
Owner Type
Purchase Details
Closed on
Dec 31, 2014
Sold by
Cutaia James and Cutaia Diane
Bought by
Hemenway Vernon
Current Estimated Value
Home Financials for this Owner
Home Financials are based on the most recent Mortgage that was taken out on this home.
Original Mortgage
$184,000
Outstanding Balance
$141,815
Interest Rate
4.01%
Mortgage Type
New Conventional
Estimated Equity
$276,395
Purchase Details
Closed on
Oct 17, 2014
Sold by
Bank Of New York Mellon
Bought by
Hemenway Vernon
Purchase Details
Closed on
Feb 17, 2014
Sold by
Lepola William M and Lepola Karen E
Bought by
The Bank Of New York Mellon
Purchase Details
Closed on
Feb 10, 1997
Sold by
Sprague William O and Sprague Karen B
Bought by
Lepola William M and Lepola Karen E
Home Financials for this Owner
Home Financials are based on the most recent Mortgage that was taken out on this home.
Original Mortgage
$112,200
Interest Rate
11.1%
Create a Home Valuation Report for This Property
The Home Valuation Report is an in-depth analysis detailing your home's value as well as a comparison with similar homes in the area
Home Values in the Area
Average Home Value in this Area
Purchase History
| Date | Buyer | Sale Price | Title Company |
|---|---|---|---|
| Hemenway Vernon | -- | None Available | |
| Hemenway Vernon | -- | -- | |
| The Bank Of New York Mellon | $157,950 | None Available | |
| Lepola William M | -- | -- |
Source: Public Records
Mortgage History
| Date | Status | Borrower | Loan Amount |
|---|---|---|---|
| Open | Hemenway Vernon | $184,000 | |
| Previous Owner | Lepola William M | $112,200 |
Source: Public Records
Tax History Compared to Growth
Tax History
| Year | Tax Paid | Tax Assessment Tax Assessment Total Assessment is a certain percentage of the fair market value that is determined by local assessors to be the total taxable value of land and additions on the property. | Land | Improvement |
|---|---|---|---|---|
| 2025 | $3,138 | $261,448 | $46,170 | $215,278 |
| 2024 | $3,111 | $263,824 | $46,170 | $217,654 |
| 2023 | $3,111 | $263,050 | $46,170 | $243,870 |
| 2022 | $3,718 | $239,140 | $46,170 | $243,870 |
| 2021 | $4,321 | $217,400 | $46,170 | $248,060 |
| 2020 | $3,961 | $197,640 | $46,170 | $255,210 |
| 2019 | $3,547 | $179,670 | $19,640 | $160,030 |
| 2018 | $3,197 | $179,670 | $19,640 | $160,030 |
| 2017 | $3,739 | $179,670 | $19,640 | $160,030 |
| 2016 | $3,739 | $179,670 | $19,640 | $160,030 |
| 2015 | $3,496 | $165,290 | $19,640 | $145,650 |
| 2014 | $3,496 | $165,290 | $19,640 | $145,650 |
Source: Public Records
Map
Nearby Homes
- 24500 Decker Prairie-Rosehill Rc
- 25404 Decker Prairie-Rosehill Rd
- 23914 Clouds Rest
- 27303 Decker Prairie-Rosehill Rd
- 26407 Red Clover Dr
- 25717 Merino Ct
- 26443 Red Clover Dr
- 23902 Decker Prairie-Rosehill Rd
- 25822 Bridle Creek Dr N
- 26354 Cedar Sedge Dr
- 26234 Arrowleaf Dr
- 25823 Bridle Creek Dr S
- 26255 Arrowleaf Dr
- Lot 34 Walnut Crossing
- 26017 Hampshire Dr
- 26266 Arrowleaf Dr
- 26270 Arrowleaf Dr
- 26275 Arrowleaf Dr
- 26274 Arrowleaf Dr
- 26279 Arrowleaf Dr
- 24419 Brautigam Rd
- 24403 Brautigam Rd
- 24410 Brautigam Rd
- 24418 Brautigam Rd
- 25025 Decker Prairie Rosehl Rd
- 24503 Brautigam Rd
- 24502 Brautigam Rd
- 24411 Lori Ln
- 24511 Brautigam Rd
- 24419 Lori Ln
- 24403 Lori Ln
- 24955 Decker Prairie Rosehl Rd
- 24603 Brautigam Rd
- 24511 Lori Ln
- 24602 Brautigam Rd
- 24410 Lori Ln
- 24406 Lori Ln
- 24418 Lori Ln
- 24502 Lori Ln
- 24603 Lori Ln