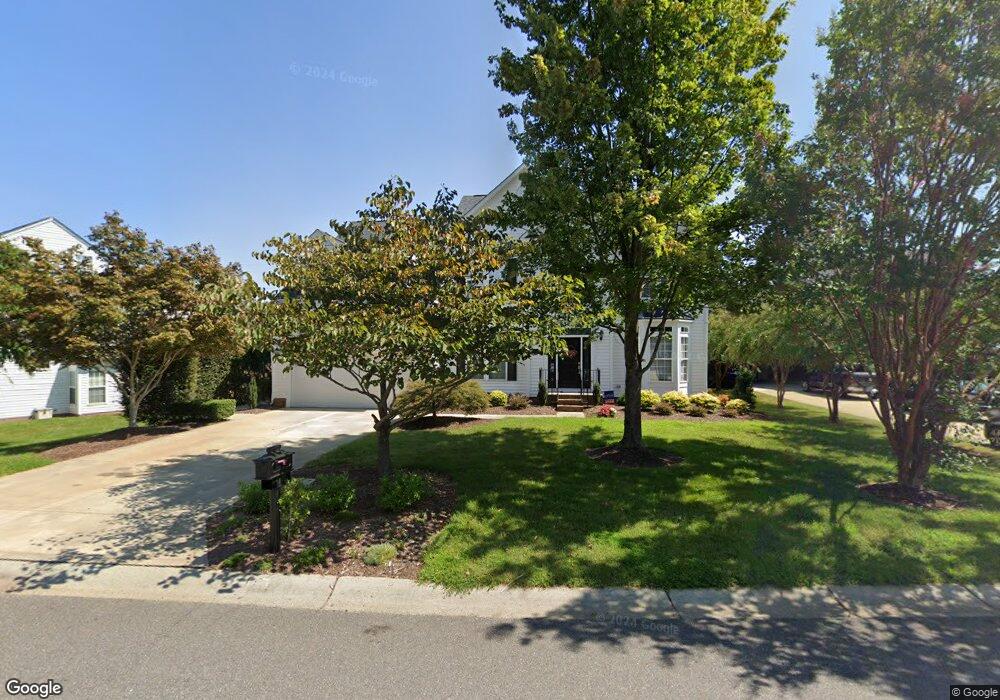
2442 Smith Cove Rd Unit 180 Denver, NC 28037
Estimated Value: $678,000 - $778,002
4
Beds
4
Baths
3,958
Sq Ft
$185/Sq Ft
Est. Value
About This Home
This home is located at 2442 Smith Cove Rd Unit 180, Denver, NC 28037 and is currently estimated at $733,751, approximately $185 per square foot. 2442 Smith Cove Rd Unit 180 is a home located in Lincoln County with nearby schools including St. James Elementary School, East Lincoln Middle School, and East Lincoln High School.
Ownership History
Date
Name
Owned For
Owner Type
Purchase Details
Closed on
Jun 26, 2023
Sold by
Davenport William R and Davenport Tamara L
Bought by
Uribe Nicolas and Boland Lindsay
Current Estimated Value
Home Financials for this Owner
Home Financials are based on the most recent Mortgage that was taken out on this home.
Original Mortgage
$650,000
Outstanding Balance
$633,308
Interest Rate
6.39%
Mortgage Type
New Conventional
Estimated Equity
$100,443
Purchase Details
Closed on
Aug 24, 2020
Sold by
Williams Scott H and Williams Tara A
Bought by
Davenport William R
Home Financials for this Owner
Home Financials are based on the most recent Mortgage that was taken out on this home.
Original Mortgage
$452,020
Interest Rate
2.9%
Mortgage Type
New Conventional
Purchase Details
Closed on
Feb 25, 2004
Bought by
Williams Scott H and Williams Tara A
Purchase Details
Closed on
Dec 2, 2003
Bought by
Nvr Inc
Create a Home Valuation Report for This Property
The Home Valuation Report is an in-depth analysis detailing your home's value as well as a comparison with similar homes in the area
Home Values in the Area
Average Home Value in this Area
Purchase History
| Date | Buyer | Sale Price | Title Company |
|---|---|---|---|
| Uribe Nicolas | $700,000 | None Listed On Document | |
| Davenport William R | $466,000 | None Available | |
| Williams Scott H | $232,000 | -- | |
| Nvr Inc | $39,000 | -- |
Source: Public Records
Mortgage History
| Date | Status | Borrower | Loan Amount |
|---|---|---|---|
| Open | Uribe Nicolas | $650,000 | |
| Previous Owner | Davenport William R | $452,020 |
Source: Public Records
Tax History Compared to Growth
Tax History
| Year | Tax Paid | Tax Assessment Tax Assessment Total Assessment is a certain percentage of the fair market value that is determined by local assessors to be the total taxable value of land and additions on the property. | Land | Improvement |
|---|---|---|---|---|
| 2025 | $3,897 | $622,059 | $64,000 | $558,059 |
| 2024 | $3,861 | $622,059 | $64,000 | $558,059 |
| 2023 | $3,856 | $622,059 | $64,000 | $558,059 |
| 2022 | $2,887 | $375,085 | $52,000 | $323,085 |
| 2021 | $2,906 | $354,722 | $52,000 | $302,722 |
| 2020 | $2,472 | $354,722 | $52,000 | $302,722 |
| 2019 | $2,472 | $354,722 | $52,000 | $302,722 |
| 2018 | $2,183 | $297,391 | $55,000 | $242,391 |
| 2017 | $2,082 | $297,391 | $55,000 | $242,391 |
| 2016 | $2,073 | $297,391 | $55,000 | $242,391 |
| 2015 | $2,209 | $297,391 | $55,000 | $242,391 |
| 2014 | $2,229 | $312,939 | $55,000 | $257,939 |
Source: Public Records
Map
Nearby Homes
- 6859 Lakecrest Ct
- 6873 Lakecrest Ct
- Lot 10 Green Point Ct
- 7903 Smith Pond Dr
- 4279 Sylvan Pond Ct
- 2656 Norman Isle Dr
- 00 Lake Shore Rd S
- 1515 N Nc 16 Business Hwy
- 1150 Golden Hill Ln
- 2004 Nc Hwy 16 Business Hwy
- 1662 Sterling Branch Loop Unit 94
- 101 Silver Trace Ln Unit 101
- #92 Silver Trace Ln
- #97 Silver Trace Ln
- 5023 Silver Trace Ln
- 2576 Shanklin Ln S
- 32 Shanklin Ln S Unit 32
- 30 Shanklin Ln S Unit 30
- 7958 Unity Church Rd
- 6334 Durango Way
- 2442 Smith Cove Rd
- 2434 Smith Cove Rd
- 7848 Cove Side Dr
- 7856 Cove Side Dr
- 2426 Smith Cove Rd
- 7860 Cove Side Dr
- 13100 Smith Cove Rd
- 173 Smith Cove Rd
- #159 Smith Cove Rd
- 2418 Smith Cove Rd
- 2429 Smith Cove Rd
- 2460 Smith Cove Rd
- 2435 Smith Cove Rd
- 2423 Smith Cove Rd
- 7864 Cove Side Dr
- 2449 Smith Cove Rd
- 2400 Smith Cove Rd
- 2441 Smith Cove Rd
- 2413 Smith Cove Rd
- 2461 Smith Cove Rd