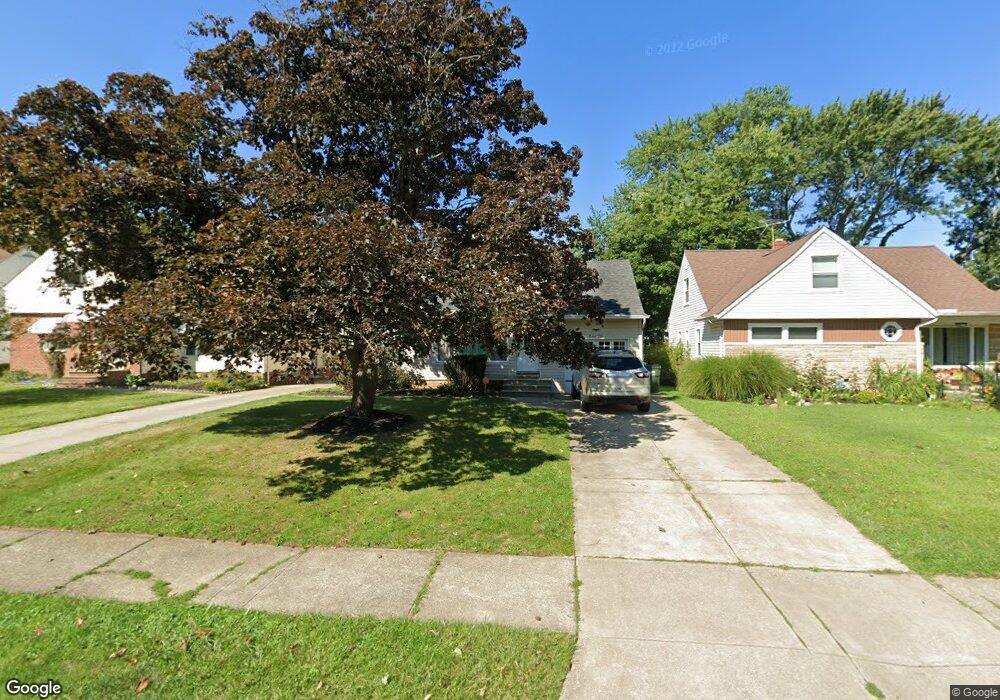
24420 Effingham Blvd Euclid, OH 44117
Estimated Value: $181,430 - $238,000
4
Beds
1
Bath
1,700
Sq Ft
$125/Sq Ft
Est. Value
About This Home
This home is located at 24420 Effingham Blvd, Euclid, OH 44117 and is currently estimated at $212,608, approximately $125 per square foot. 24420 Effingham Blvd is a home located in Cuyahoga County with nearby schools including Thomas Jefferson Elementary School, Euclid Middle School, and Euclid High School.
Ownership History
Date
Name
Owned For
Owner Type
Purchase Details
Closed on
Apr 16, 2009
Sold by
Oconnell Richard M and Oconnell Diana E
Bought by
Mcclain Robert
Current Estimated Value
Home Financials for this Owner
Home Financials are based on the most recent Mortgage that was taken out on this home.
Original Mortgage
$75,295
Outstanding Balance
$48,234
Interest Rate
5.19%
Mortgage Type
FHA
Estimated Equity
$164,374
Purchase Details
Closed on
Mar 23, 1992
Sold by
Oconnell Richard
Bought by
Oconnell Richard Michael
Purchase Details
Closed on
Aug 6, 1990
Sold by
Fletcher Wayne C
Bought by
Oconnell Richard
Purchase Details
Closed on
Dec 22, 1986
Sold by
Fletcher Wayne C
Bought by
Fletcher Wayne C
Purchase Details
Closed on
Sep 9, 1976
Sold by
Fletcher Wayne C
Bought by
Fletcher Wayne C
Purchase Details
Closed on
Jan 1, 1975
Bought by
Fletcher Wayne C
Create a Home Valuation Report for This Property
The Home Valuation Report is an in-depth analysis detailing your home's value as well as a comparison with similar homes in the area
Home Values in the Area
Average Home Value in this Area
Purchase History
| Date | Buyer | Sale Price | Title Company |
|---|---|---|---|
| Mcclain Robert | $92,500 | Chicago Title Insurance Co | |
| Oconnell Richard Michael | -- | -- | |
| Oconnell Richard | $77,500 | -- | |
| Fletcher Wayne C | -- | -- | |
| Fletcher Wayne C | $19,500 | -- | |
| Fletcher Wayne C | -- | -- |
Source: Public Records
Mortgage History
| Date | Status | Borrower | Loan Amount |
|---|---|---|---|
| Open | Mcclain Robert | $75,295 |
Source: Public Records
Tax History
| Year | Tax Paid | Tax Assessment Tax Assessment Total Assessment is a certain percentage of the fair market value that is determined by local assessors to be the total taxable value of land and additions on the property. | Land | Improvement |
|---|---|---|---|---|
| 2024 | $3,959 | $58,100 | $10,115 | $47,985 |
| 2023 | $3,100 | $35,950 | $7,880 | $28,070 |
| 2022 | $3,029 | $35,950 | $7,880 | $28,070 |
| 2021 | $3,375 | $35,950 | $7,880 | $28,070 |
| 2020 | $3,199 | $30,980 | $6,790 | $24,190 |
| 2019 | $2,877 | $88,500 | $19,400 | $69,100 |
| 2018 | $2,905 | $30,980 | $6,790 | $24,190 |
| 2017 | $3,041 | $27,090 | $5,460 | $21,630 |
| 2016 | $3,048 | $27,090 | $5,460 | $21,630 |
| 2015 | $2,774 | $27,090 | $5,460 | $21,630 |
| 2014 | $2,774 | $27,090 | $5,460 | $21,630 |
Source: Public Records
Map
Nearby Homes
- 24105 Chardon Rd
- 1775 Sherwood Blvd
- 1765 E 238th St
- 23501 Effingham Blvd
- 1754 E 236th St
- 1934 Beverly Hills Dr
- 25031 Glenbrook Blvd
- 25550 Glenbrook Blvd
- 24691 Hawthorne Dr
- 25641 Glenbrook Blvd
- 363 Balmoral Dr
- 21950 Euclid Ave
- 1554 E 221st St
- 1790 Skyline Dr
- 24991 Euclid Ave
- 1807 Skyline Dr
- 25161 Euclid Ave
- 22791 Harms Rd
- 1545 E 214th St
- 22601 Harms Rd
- 24424 Effingham Blvd
- 24416 Effingham Blvd
- 24428 Effingham Blvd
- 24412 Effingham Blvd
- 1711 E 240th St
- 24408 Effingham Blvd
- 24432 Effingham Blvd
- 1715 E 240th St
- 1707 E 240th St
- 1721 E 240th St
- 1703 E 240th St
- 24429 Effingham Blvd
- 24436 Effingham Blvd
- 24433 Effingham Blvd
- 24404 Effingham Blvd
- 24425 Effingham Blvd
- 1725 E 240th St
- 24437 Effingham Blvd
- 24440 Effingham Blvd
- 1731 E 240th St
Your Personal Tour Guide
Ask me questions while you tour the home.