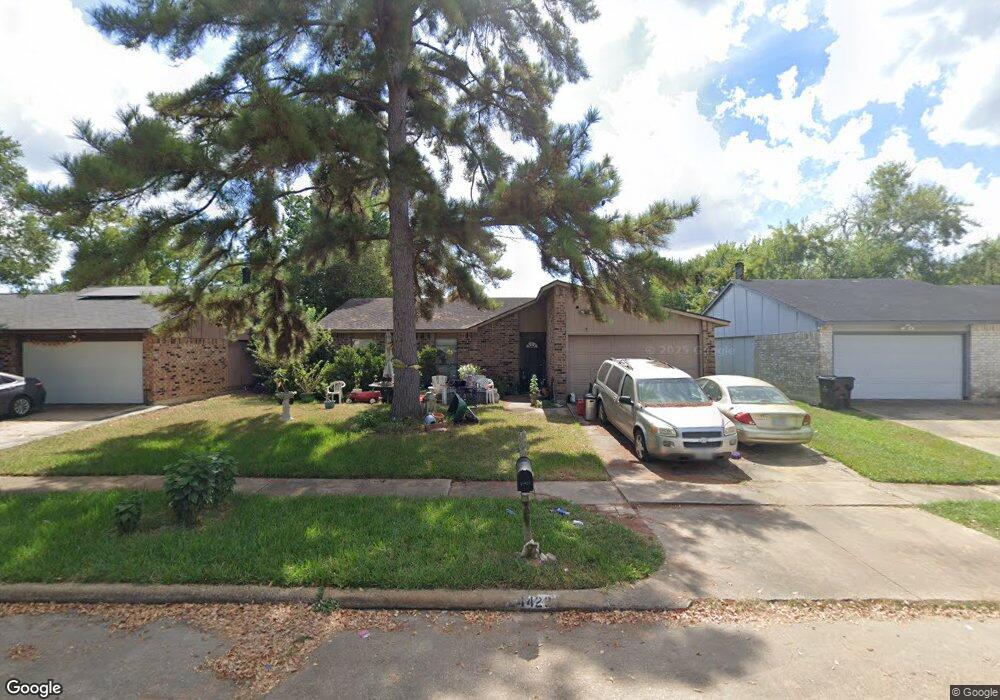
24423 Rockin Seven Dr Hockley, TX 77447
Hockley NeighborhoodEstimated Value: $205,000 - $214,000
3
Beds
2
Baths
1,365
Sq Ft
$154/Sq Ft
Est. Value
About This Home
This home is located at 24423 Rockin Seven Dr, Hockley, TX 77447 and is currently estimated at $209,706, approximately $153 per square foot. 24423 Rockin Seven Dr is a home located in Harris County with nearby schools including Roberts Road Elementary School, Waller Junior High School, and Waller High School.
Ownership History
Date
Name
Owned For
Owner Type
Purchase Details
Closed on
Mar 3, 2009
Sold by
Hoffart Barbara J
Bought by
Hoffart Grace Mae
Current Estimated Value
Purchase Details
Closed on
Jan 31, 2008
Sold by
Grace Mae Hoffart Revocable Trust
Bought by
Hoffart Barbara J and Grace Mae Hoffart Irrevocable Trust
Purchase Details
Closed on
Dec 31, 2007
Sold by
Hoffart Grace Mae
Bought by
Hoffart Barbara H and Grace Mae Hoffart Revocable Trust
Purchase Details
Closed on
Jul 31, 2000
Sold by
Dahlke Shannon E and Dahlke Terry L
Bought by
Hoffart Grace
Purchase Details
Closed on
Nov 4, 1993
Sold by
Va
Bought by
Primeaux Shannon E
Home Financials for this Owner
Home Financials are based on the most recent Mortgage that was taken out on this home.
Original Mortgage
$45,081
Interest Rate
6.86%
Mortgage Type
Seller Take Back
Create a Home Valuation Report for This Property
The Home Valuation Report is an in-depth analysis detailing your home's value as well as a comparison with similar homes in the area
Home Values in the Area
Average Home Value in this Area
Purchase History
| Date | Buyer | Sale Price | Title Company |
|---|---|---|---|
| Hoffart Grace Mae | -- | None Available | |
| Hoffart Barbara J | -- | None Available | |
| Hoffart Barbara H | -- | None Available | |
| Hoffart Grace | -- | Chicago Title | |
| Primeaux Shannon E | -- | -- |
Source: Public Records
Mortgage History
| Date | Status | Borrower | Loan Amount |
|---|---|---|---|
| Previous Owner | Primeaux Shannon E | $45,081 |
Source: Public Records
Tax History Compared to Growth
Tax History
| Year | Tax Paid | Tax Assessment Tax Assessment Total Assessment is a certain percentage of the fair market value that is determined by local assessors to be the total taxable value of land and additions on the property. | Land | Improvement |
|---|---|---|---|---|
| 2025 | $4,596 | $191,999 | $34,650 | $157,349 |
| 2024 | $4,596 | $184,914 | $34,650 | $150,264 |
| 2023 | $4,596 | $187,588 | $34,650 | $152,938 |
| 2022 | $4,396 | $164,652 | $34,650 | $130,002 |
| 2021 | $3,816 | $136,487 | $28,350 | $108,137 |
| 2020 | $3,495 | $121,082 | $26,775 | $94,307 |
| 2019 | $3,351 | $112,261 | $22,050 | $90,211 |
| 2018 | $817 | $97,855 | $22,050 | $75,805 |
| 2017 | $2,892 | $97,855 | $22,050 | $75,805 |
| 2016 | $2,559 | $86,607 | $22,050 | $64,557 |
| 2015 | $1,078 | $80,050 | $15,120 | $64,930 |
| 2014 | $1,078 | $53,819 | $15,120 | $38,699 |
Source: Public Records
Map
Nearby Homes
- 24402 Jumping Jay Dr
- 24310 Rockin Seven Dr
- 24414 Broken Bow Ln
- 0 Lazy Kay Ln
- 24303 Four Sixes Ln
- 17506 Bullis Gap Dr
- 2076 Stallion Lakes Ave
- 24211 Four Sixes Ln
- 24039 Rockin Seven Dr
- 24231 Wild Horse Ln
- 24503 Wild Horse Ln
- 24402 Bar Kay Ln
- 17247 Osprey Forest Dr
- 17419 Lavender Blossom Ln
- 17503 Lavender Blossom Ln
- 17423 Lavender Blossom Ln
- 17607 Lavender Blossom Ln
- 17222 Osprey Landing Dr
- 32115 Waterlily View Ct
- Tyler Plan at Dellrose
- 24419 Rockin Seven Dr
- 24427 Rockin Seven Dr
- 24422 Beef Canyon Dr
- 24415 Rockin Seven Dr
- 24426 Beef Canyon Dr
- 24418 Beef Canyon Dr
- 24414 Beef Canyon Dr
- 24422 Rockin Seven Dr
- 24418 Rockin Seven Dr
- 24411 Rockin Seven Dr
- 24426 Rockin Seven Dr
- 24414 Rockin 7 Dr
- 24414 Rockin Seven Dr
- 17411 Wagganner Dr
- 17415 Wagganner Dr
- 17407 Wagganner Dr
- 24407 Rockin Seven Dr
- 17419 Wagganner Dr
- 24410 Rockin Seven Dr
- 17403 Wagganner Dr