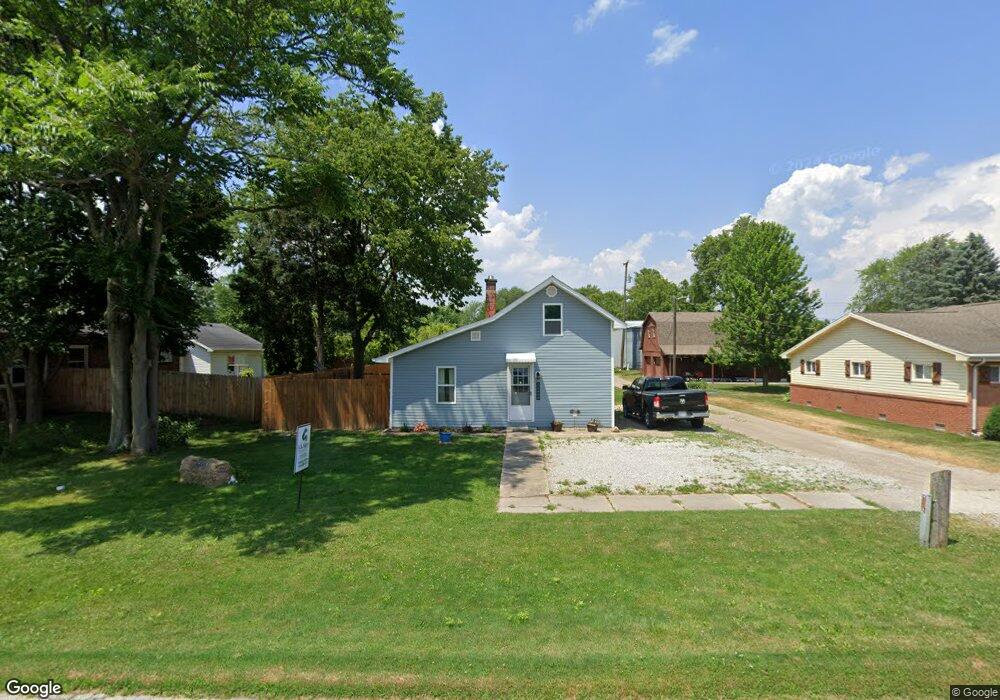
24444 3rd St Grand Rapids, OH 43522
Estimated Value: $132,000 - $202,000
About This Home
This home is located at 24444 3rd St, Grand Rapids, OH 43522 and is currently estimated at $156,966, approximately $193 per square foot. 24444 3rd St is a home located in Wood County with nearby schools including Otsego Elementary School, Otsego Junior High School, and Otsego High School.
Ownership History
We collect this data history from publicly available records. To have your information removed, we recommend requesting removal directly through your county’s website.
Purchase Details
Home Financials for this Owner
Home Financials are based on the most recent Mortgage that was taken out on this home.Purchase Details
Home Financials for this Owner
Home Financials are based on the most recent Mortgage that was taken out on this home.Purchase Details
Purchase Details
Purchase Details
Purchase History
We collect this data history from publicly available records. To have your information removed, we recommend requesting removal directly through your county’s website.
| Date | Buyer | Sale Price | Title Company |
|---|---|---|---|
| $145,000 | None Listed On Document | ||
| $33,800 | None Listed On Document | ||
| -- | Attorney | ||
| $15,000 | -- | ||
| $9,000 | -- |
Mortgage History
We collect this data history from publicly available records. To have your information removed, we recommend requesting removal directly through your county’s website.
| Date | Status | Borrower | Loan Amount |
|---|---|---|---|
| Open | $145,000 | ||
| Previous Owner | $33,781 |
Tax History
We collect this data history from publicly available records. To have your information removed, we recommend requesting removal directly through your county’s website.
| Year | Tax Paid | Tax Assessment Tax Assessment Total Assessment is a certain percentage of the fair market value that is determined by local assessors to be the total taxable value of land and additions on the property. | Land | Improvement |
|---|---|---|---|---|
| 2025 | $1,050 | $22,820 | $5,180 | $17,640 |
| 2024 | $1,067 | $22,820 | $5,180 | $17,640 |
| 2023 | $1,067 | $22,820 | $5,180 | $17,640 |
| 2021 | $543 | $10,470 | $4,940 | $5,530 |
| 2020 | $544 | $10,470 | $4,940 | $5,530 |
| 2019 | $521 | $9,700 | $4,940 | $4,760 |
| 2018 | $509 | $9,700 | $4,940 | $4,760 |
| 2017 | $495 | $9,700 | $4,940 | $4,760 |
| 2016 | $474 | $9,420 | $5,180 | $4,240 |
| 2015 | $492 | $9,420 | $5,180 | $4,240 |
| 2014 | $467 | $9,420 | $5,180 | $4,240 |
| 2013 | $483 | $8,970 | $4,940 | $4,030 |
Map
- 23694 E 2nd St
- 16537 Wapakoneta Rd
- 9100 Providence-Neapolis-swanton Rd
- 707 Catherine Dr
- T198 County Road 3
- 13210 Perry Rd
- 215 Reed St
- 245 N East St
- 10855 S River Rd
- 560 W Summit St
- 535 Main St
- 15699 Otsego Pike
- 11 Old Coach Rd
- 77 Back Bay Rd
- 60 Back Bay Rd
- 0 Kellogg Rd Unit 6125521
- 0 E Back Bay Rd E
- 0 W River Rd Unit 10000155
- 13795 Van Tassel Rd
- 447 Washington St
Ask me questions while you tour the home.