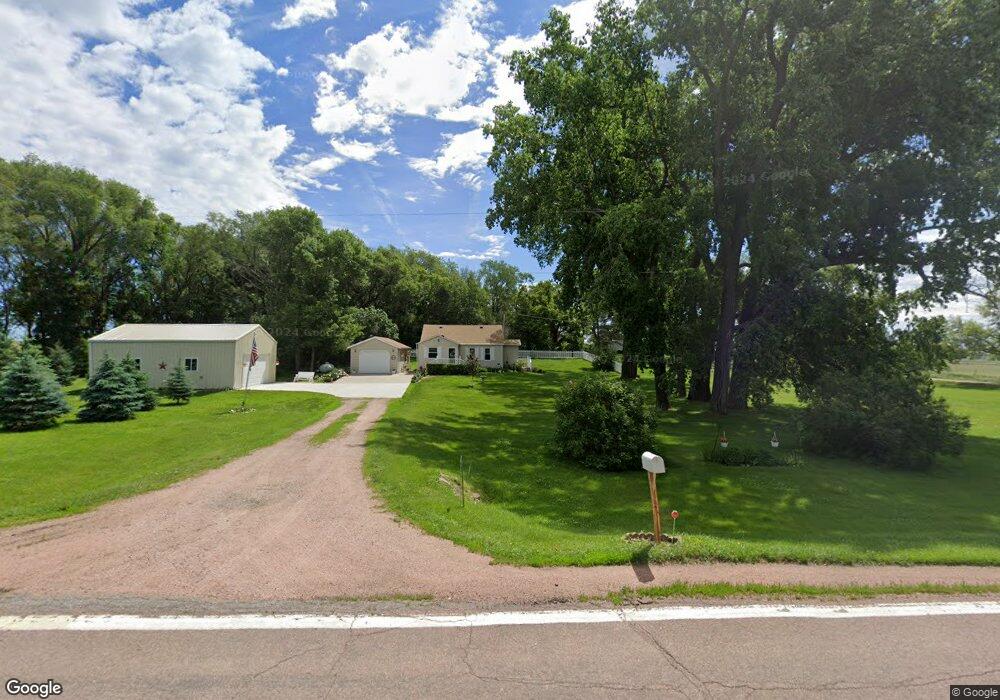
24446 475th Ave Dell Rapids, SD 57022
Estimated Value: $150,391 - $243,000
3
Beds
2
Baths
1,064
Sq Ft
$164/Sq Ft
Est. Value
About This Home
This home is located at 24446 475th Ave, Dell Rapids, SD 57022 and is currently estimated at $174,848, approximately $164 per square foot. 24446 475th Ave is a home located in Minnehaha County with nearby schools including Dell Rapids Elementary School, Dell Rapids Middle School, and Dell Rapids High School.
Ownership History
Date
Name
Owned For
Owner Type
Purchase Details
Closed on
Nov 5, 2024
Sold by
Estate Of Jay Arthur Nebben and Nebben
Bought by
Nebben Peter J and Nebben Jennifer A
Current Estimated Value
Purchase Details
Closed on
Sep 6, 2024
Sold by
Nebben Jennifer A
Bought by
Nebben Peter J and Nebben Sydney R
Create a Home Valuation Report for This Property
The Home Valuation Report is an in-depth analysis detailing your home's value as well as a comparison with similar homes in the area
Purchase History
| Date | Buyer | Sale Price | Title Company |
|---|---|---|---|
| Nebben Peter J | -- | -- | |
| Nebben Peter J | $90,000 | -- |
Source: Public Records
Tax History
| Year | Tax Paid | Tax Assessment Tax Assessment Total Assessment is a certain percentage of the fair market value that is determined by local assessors to be the total taxable value of land and additions on the property. | Land | Improvement |
|---|---|---|---|---|
| 2024 | $2,137 | $210,300 | $64,400 | $145,900 |
| 2023 | $2,055 | $182,500 | $49,500 | $133,000 |
| 2022 | $1,790 | $153,800 | $38,100 | $115,700 |
| 2021 | $1,580 | $144,100 | $0 | $0 |
| 2020 | $1,580 | $128,500 | $0 | $0 |
| 2019 | $1,570 | $132,751 | $0 | $0 |
| 2018 | $1,515 | $130,766 | $0 | $0 |
| 2017 | $1,528 | $121,035 | $29,250 | $91,785 |
| 2016 | $1,528 | $119,734 | $29,250 | $90,484 |
| 2015 | $1,555 | $115,534 | $27,000 | $88,534 |
| 2014 | -- | $115,158 | $27,000 | $88,158 |
Source: Public Records
Map
Nearby Homes
- 1307 Clark Ave
- 904 E 11th St
- 1606 Julie Ave Unit L22B2
- 1604 Julie Cir Unit L21B2
- 1600 Julie Cir Unit L19B2
- 1607 Julie Cir Unit L9B2
- 1602 Julie Cir Unit L20B2
- 1504 Julie Cir Unit L17B2
- 1603 Julie Cir Unit L11B2
- 1601 Julie Cir Unit L12B2
- 1605 Julie Cir Unit L10B2
- 1606 Neil Ave Unit L8B2
- 302 W 17th St
- 1506 Julie Cir Unit L18B2
- 1604 Neil Ave Unit L7B2
- 1602 Neil Ave Unit L6B2
- 1600 Neil Ave Unit L5B2
- 1502 Julie Cir Unit L16B2
- 1504 Neil Ave Unit L3B2
- 1505 Julie Cir Unit L14B2
- 24444 475th Ave
- 24447 475th Ave
- 24448 475th Ave
- 702 E 15th St
- 504 E 15th St
- 601 E 15th St
- 511 E 15th St
- 603 E 15th St
- 509 E 15th St
- 507 E 15th St
- 1217 N Garfield Ave
- 505 E 15th St
- 503 E 15th St
- 47486 244th St
- 1215 N Garfield Ave
- 1216 Thresher Dr
- 1218 Thresher Dr
- 409 E 15th St
- 1220 Thresher Dr
- 407 E 15th St
Your Personal Tour Guide
Ask me questions while you tour the home.