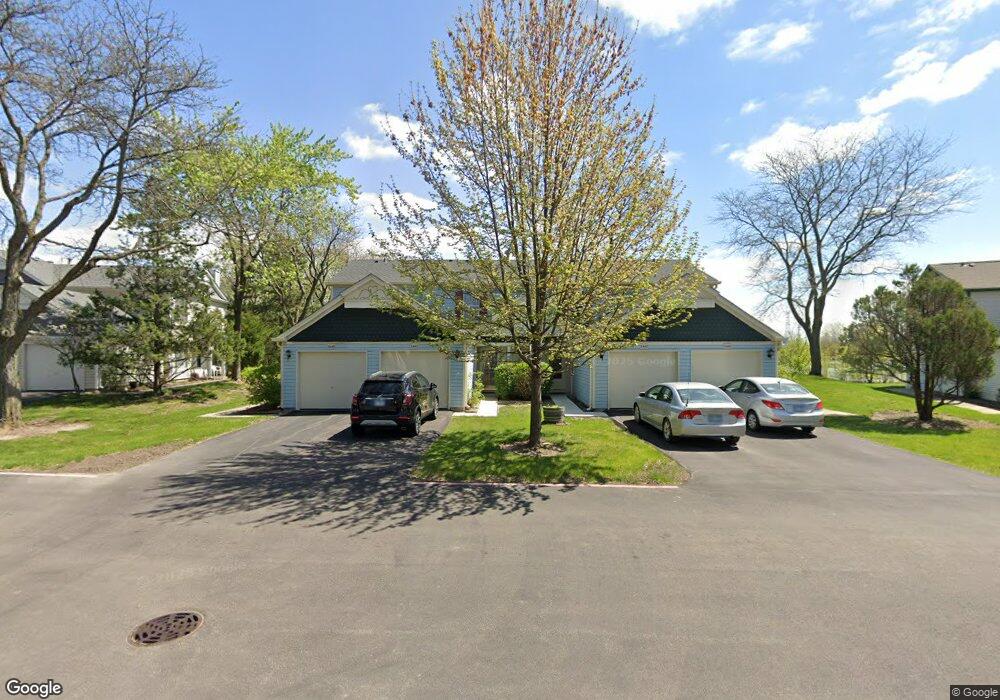
2445 Devonshire Ct Unit 2 Aurora, IL 60502
Big Woods Marmion NeighborhoodEstimated Value: $205,771 - $259,000
1
Bed
2
Baths
784
Sq Ft
$284/Sq Ft
Est. Value
About This Home
This home is located at 2445 Devonshire Ct Unit 2, Aurora, IL 60502 and is currently estimated at $222,943, approximately $284 per square foot. 2445 Devonshire Ct Unit 2 is a home located in DuPage County with nearby schools including Gwendolyn Brooks Elementary School, Francis Granger Middle School, and Metea Valley High School.
Ownership History
Date
Name
Owned For
Owner Type
Purchase Details
Closed on
Mar 20, 2024
Sold by
James E Byrne Living Trust and Byrne Janice F
Bought by
Janice F Byrne Living Trust and Byrne
Current Estimated Value
Purchase Details
Closed on
Jul 9, 2014
Sold by
Byrne James E and Byrne Janice F
Bought by
Byrne James E and James E Byrne Living Trust
Purchase Details
Closed on
Aug 30, 2001
Sold by
Blomberg Brian and Maris Kareen
Bought by
Byrne James and Byrne Janice
Home Financials for this Owner
Home Financials are based on the most recent Mortgage that was taken out on this home.
Original Mortgage
$76,000
Interest Rate
7.06%
Purchase Details
Closed on
Oct 20, 1995
Sold by
Bagnall Kelly M and Hesse Kelly M
Bought by
Blomberg Brian and Maris Karen
Home Financials for this Owner
Home Financials are based on the most recent Mortgage that was taken out on this home.
Original Mortgage
$66,500
Interest Rate
7.65%
Create a Home Valuation Report for This Property
The Home Valuation Report is an in-depth analysis detailing your home's value as well as a comparison with similar homes in the area
Home Values in the Area
Average Home Value in this Area
Purchase History
| Date | Buyer | Sale Price | Title Company |
|---|---|---|---|
| Janice F Byrne Living Trust | -- | None Listed On Document | |
| Byrne James E | -- | None Available | |
| Byrne James | $96,000 | Stewart Title Company | |
| Blomberg Brian | $70,000 | Intercounty Title |
Source: Public Records
Mortgage History
| Date | Status | Borrower | Loan Amount |
|---|---|---|---|
| Previous Owner | Byrne James | $76,000 | |
| Previous Owner | Blomberg Brian | $66,500 |
Source: Public Records
Tax History
| Year | Tax Paid | Tax Assessment Tax Assessment Total Assessment is a certain percentage of the fair market value that is determined by local assessors to be the total taxable value of land and additions on the property. | Land | Improvement |
|---|---|---|---|---|
| 2024 | $3,226 | $50,425 | $19,175 | $31,250 |
| 2023 | $3,032 | $45,310 | $17,230 | $28,080 |
| 2022 | $2,938 | $41,040 | $15,500 | $25,540 |
| 2021 | $2,849 | $39,580 | $14,950 | $24,630 |
| 2020 | $2,884 | $39,580 | $14,950 | $24,630 |
| 2019 | $2,765 | $37,650 | $14,220 | $23,430 |
| 2018 | $2,152 | $30,370 | $11,320 | $19,050 |
| 2017 | $1,942 | $27,550 | $10,270 | $17,280 |
| 2016 | $1,751 | $24,940 | $9,300 | $15,640 |
| 2015 | $1,710 | $23,680 | $8,830 | $14,850 |
| 2014 | $1,538 | $21,440 | $7,950 | $13,490 |
| 2013 | $1,525 | $21,580 | $8,000 | $13,580 |
Source: Public Records
Map
Nearby Homes
- 2615 Prairieview Ln
- 2630 White Barn Rd
- 2667 Charter Oak Dr
- 2284 Scott Ln Unit 2284
- 2331 Handley Ln
- 2819 Clarissa Ln
- 1600 Harris Dr
- 2428 Ridgewood Ct
- 1757 Pinnacle Dr
- 2315 Nan St
- 3161 Hopewell Dr
- 1942 Tall Oaks Dr Unit 3B
- 1223 Townes Cir Unit 48
- 2752 Preserve Cir Unit 13006
- 2748 Preserve Cir Unit 13005
- 2732 Preserve Cir Unit 13001
- 2892 Preserve Cir Unit 5003
- 2888 Preserve Cir Unit 5002
- 6S371 Old Eola Rd
- 1751 Gary Ave
- 2447 Devonshire Ct Unit 2
- 2443 Devonshire Ct Unit 2
- 2449 Devonshire Ct
- 2439 Devonshire Ct
- 2453 Devonshire Ct Unit 2
- 2437 Devonshire Ct
- 2437 Devonshire Ct Unit 2437
- 2437 Devonshire Ct Unit 2436
- 2455 Devonshire Ct
- 2435 Devonshire Ct
- 2457 Devonshire Ct
- 2433 Devonshire Ct
- 2456 Devonshire Ct
- 2459 Devonshire Ct
- 2452 Devonshire Ct
- 2454 Devonshire Ct
- 2450 Devonshire Ct
- 2460 Devonshire Ct
- 2462 Devonshire Ct
- 2430 Devonshire Ct
Your Personal Tour Guide
Ask me questions while you tour the home.