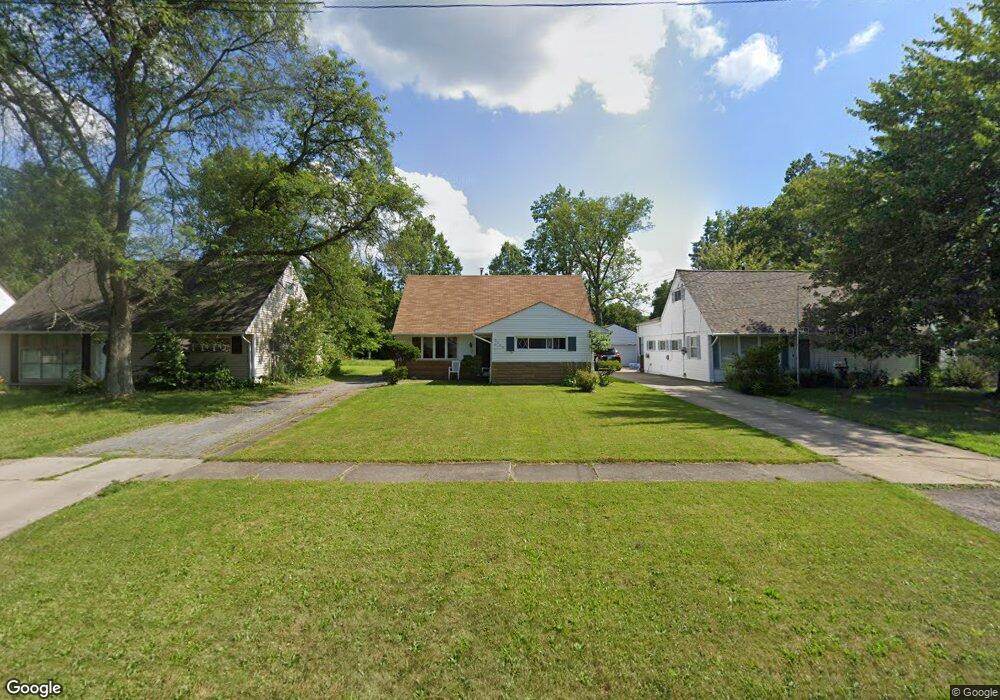
2445 Northwest Blvd NW Warren, OH 44485
Austin Village NeighborhoodEstimated Value: $46,000 - $61,000
4
Beds
1
Bath
1,008
Sq Ft
$56/Sq Ft
Est. Value
About This Home
This home is located at 2445 Northwest Blvd NW, Warren, OH 44485 and is currently estimated at $56,851, approximately $56 per square foot. 2445 Northwest Blvd NW is a home located in Trumbull County with nearby schools including McGuffey School, Warren G. Harding High School, and Steam Academy of Warren.
Ownership History
Date
Name
Owned For
Owner Type
Purchase Details
Closed on
Apr 6, 2022
Sold by
Ashok Nimgade Md Pc 401K Plan
Bought by
Birch Knot Properties Llc
Current Estimated Value
Purchase Details
Closed on
Dec 9, 2010
Sold by
Funtulis Property Group Llc
Bought by
Ashok Nimgade Md Pc 401 K Plan
Home Financials for this Owner
Home Financials are based on the most recent Mortgage that was taken out on this home.
Original Mortgage
$19,000
Interest Rate
4.23%
Mortgage Type
Seller Take Back
Purchase Details
Closed on
Oct 6, 2010
Sold by
Fannie Mae
Bought by
Funtulis Property Group Llc
Purchase Details
Closed on
Feb 24, 2010
Sold by
Bell William D
Bought by
Federal National Mortgage Association
Purchase Details
Closed on
Dec 29, 1998
Sold by
Taylor Joann H
Bought by
Bell William D and Bell Shavi L
Purchase Details
Closed on
Jan 1, 1990
Bought by
Darcy A Larson
Create a Home Valuation Report for This Property
The Home Valuation Report is an in-depth analysis detailing your home's value as well as a comparison with similar homes in the area
Home Values in the Area
Average Home Value in this Area
Purchase History
| Date | Buyer | Sale Price | Title Company |
|---|---|---|---|
| Birch Knot Properties Llc | $34,000 | Burkey Burkey And Scher Co Lpa | |
| Ashok Nimgade Md Pc 401 K Plan | $39,000 | The Title Company Of Warren | |
| Funtulis Property Group Llc | $11,000 | None Available | |
| Federal National Mortgage Association | $22,000 | None Available | |
| Bell William D | $45,500 | -- | |
| Darcy A Larson | -- | -- |
Source: Public Records
Mortgage History
| Date | Status | Borrower | Loan Amount |
|---|---|---|---|
| Previous Owner | Ashok Nimgade Md Pc 401 K Plan | $19,000 |
Source: Public Records
Tax History Compared to Growth
Tax History
| Year | Tax Paid | Tax Assessment Tax Assessment Total Assessment is a certain percentage of the fair market value that is determined by local assessors to be the total taxable value of land and additions on the property. | Land | Improvement |
|---|---|---|---|---|
| 2024 | $743 | $14,670 | $2,240 | $12,430 |
| 2023 | $743 | $14,670 | $2,240 | $12,430 |
| 2022 | $730 | $11,270 | $2,240 | $9,030 |
| 2021 | $732 | $11,270 | $2,240 | $9,030 |
| 2020 | $733 | $11,270 | $2,240 | $9,030 |
| 2019 | $743 | $10,850 | $2,240 | $8,610 |
| 2018 | $740 | $10,850 | $2,240 | $8,610 |
| 2017 | $729 | $10,850 | $2,240 | $8,610 |
| 2016 | $902 | $13,900 | $2,980 | $10,920 |
| 2015 | $896 | $13,900 | $2,980 | $10,920 |
| 2014 | $891 | $13,900 | $2,980 | $10,920 |
| 2013 | $1,054 | $17,330 | $2,980 | $14,350 |
Source: Public Records
Map
Nearby Homes
- 2144 Northwest Blvd NW
- 2879 Linda Dr NW
- 1727 Lexington Ave NW
- 1647 Southern Blvd NW
- 1552 Denison Ave NW
- 2931 Randolph St NW
- 1945 Norwood St NW
- 1936 Norwood St NW
- 1325 Moncrest Dr NW
- 1166 Raymond St NW
- 3000 Parkman Rd NW
- 1056 Orlo Dr NW
- 1351 Bradford St NW
- 1331 Bradford St NW
- 666 Dickey Ave NW
- 589 Briggs Rd
- 983 Garden St NW
- 2941 Regal Dr NW
- 806 Parkman Rd NW
- 1315 Westwood Dr NW
- 2455 Northwest Blvd NW
- 2435 Northwest Blvd NW
- 2465 Northwest Blvd NW
- 2425 Northwest Blvd NW
- 2415 Northwest Blvd NW
- 2475 Northwest Blvd NW
- 2390 Stewart Dr NW
- 2380 Stewart Dr NW
- 2400 Stewart Dr NW
- 2405 Northwest Blvd NW
- 2368 Stewart Dr NW
- 2456 Northwest Blvd NW
- 2436 Northwest Blvd NW
- 2356 Stewart Dr NW
- 2410 Stewart Dr NW
- 2501 Northwest Blvd NW
- 2446 Northwest Blvd NW
- 2335 Northwest Blvd NW
- 2346 Stewart Dr NW
- 2466 Northwest Blvd NW