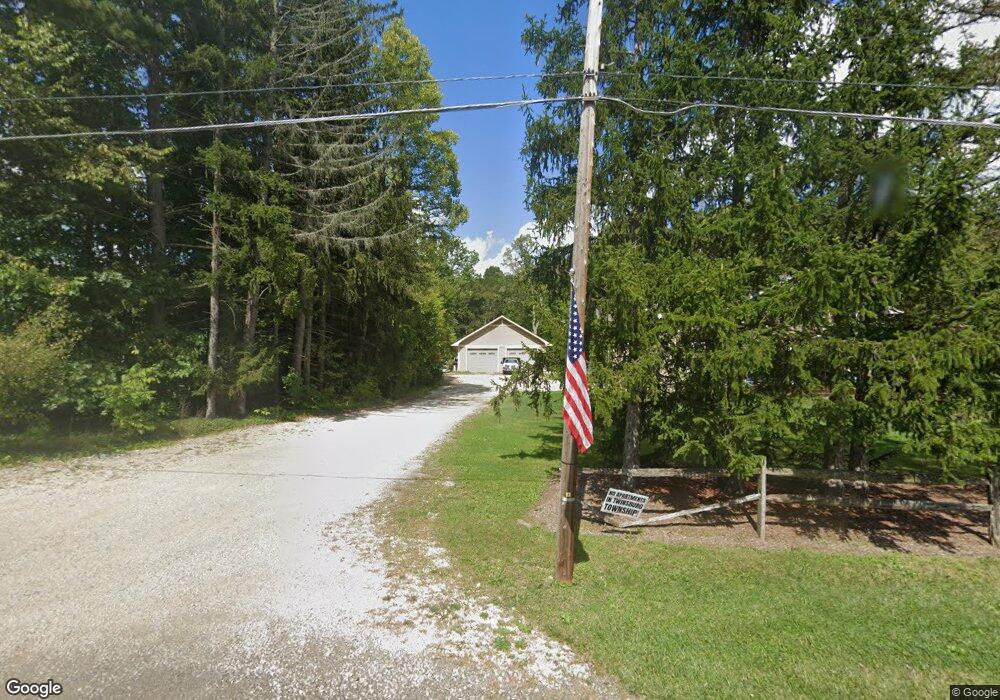
2445 Old Mill Rd Hudson, OH 44236
Estimated Value: $359,000 - $629,496
4
Beds
3
Baths
3,792
Sq Ft
$132/Sq Ft
Est. Value
About This Home
This home is located at 2445 Old Mill Rd, Hudson, OH 44236 and is currently estimated at $500,124, approximately $131 per square foot. 2445 Old Mill Rd is a home located in Summit County with nearby schools including Wilcox Primary School, Dodge Intermediate School, and Samuel Bissell Elementary School.
Ownership History
Date
Name
Owned For
Owner Type
Purchase Details
Closed on
Mar 2, 2009
Sold by
Sutkowski Mark R
Bought by
Sutkowski Mark R and Sutkowski Dawn M
Current Estimated Value
Home Financials for this Owner
Home Financials are based on the most recent Mortgage that was taken out on this home.
Original Mortgage
$190,272
Outstanding Balance
$92,470
Interest Rate
5.14%
Mortgage Type
FHA
Estimated Equity
$407,654
Purchase Details
Closed on
May 24, 2005
Sold by
Shortridge Carl E and Shortridge Debra Jo
Bought by
Sutkowski Mark R
Home Financials for this Owner
Home Financials are based on the most recent Mortgage that was taken out on this home.
Original Mortgage
$126,400
Interest Rate
5.62%
Mortgage Type
Fannie Mae Freddie Mac
Purchase Details
Closed on
Jan 24, 2001
Sold by
Casey Joseph R
Bought by
Shortridge Carl E and Shortridge Debra Jo
Create a Home Valuation Report for This Property
The Home Valuation Report is an in-depth analysis detailing your home's value as well as a comparison with similar homes in the area
Home Values in the Area
Average Home Value in this Area
Purchase History
| Date | Buyer | Sale Price | Title Company |
|---|---|---|---|
| Sutkowski Mark R | -- | Ams Title | |
| Sutkowski Mark R | $158,000 | Ams Title | |
| Shortridge Carl E | -- | Ams Title | |
| Shortridge Carl E | $89,900 | Gateway Title Agency Inc |
Source: Public Records
Mortgage History
| Date | Status | Borrower | Loan Amount |
|---|---|---|---|
| Open | Sutkowski Mark R | $190,272 | |
| Closed | Sutkowski Mark R | $126,400 | |
| Closed | Sutkowski Mark R | $31,600 |
Source: Public Records
Tax History Compared to Growth
Tax History
| Year | Tax Paid | Tax Assessment Tax Assessment Total Assessment is a certain percentage of the fair market value that is determined by local assessors to be the total taxable value of land and additions on the property. | Land | Improvement |
|---|---|---|---|---|
| 2025 | $10,918 | $155,544 | $25,449 | $130,095 |
| 2024 | $7,534 | $155,544 | $25,449 | $130,095 |
| 2023 | $10,918 | $155,544 | $25,449 | $130,095 |
| 2022 | $6,077 | $112,392 | $18,179 | $94,213 |
| 2021 | $6,106 | $112,392 | $18,179 | $94,213 |
| 2020 | $5,923 | $112,390 | $18,180 | $94,210 |
| 2019 | $5,558 | $98,510 | $21,030 | $77,480 |
| 2018 | $5,484 | $98,510 | $21,030 | $77,480 |
| 2017 | $3,517 | $98,510 | $21,030 | $77,480 |
| 2016 | $3,495 | $67,430 | $21,030 | $46,400 |
| 2015 | $3,517 | $67,430 | $21,030 | $46,400 |
| 2014 | $3,510 | $67,430 | $21,030 | $46,400 |
| 2013 | $3,533 | $67,940 | $21,030 | $46,910 |
Source: Public Records
Map
Nearby Homes
- 2219 Fairway Blvd Unit 4E
- 2061 Garden Ln
- 2346 Danbury Ln
- 2664 Easthaven Dr
- 7589 Hudson Park Dr
- 3590 E Aurora Rd
- 7471 Woodspring Ln
- 7753 Red Fox Trail
- 7511 Herrick Park Dr
- 8028 Megan Meadow Dr
- 3284 Cannon Rd
- 7603 Red Fox Trail
- 3425 Eryn Place
- 1593 Stonington Dr
- 2221 Kate Ct
- 2064 Case St
- 1644 Stonington Dr
- 7687 Ravenna Rd
- 1288 Juniper Ct
- 1366 Twinsburg Rd E
- 2446 Old Mill Rd
- 2417 Old Mill Rd
- 2414 Old Mill Rd
- 2462 Old Mill Rd
- 2485 Old Mill Rd
- 8029 McGhee Ln
- 2386 Old Mill Rd
- 2365 Old Mill Rd
- 2360 Old Mill Rd
- 2512 Old Mill Rd
- 8010 McGhee Ln
- 2340 Old Mill Rd
- 2520 Old Mill Rd
- 2550 Old Mill Rd
- 2320 Old Mill Rd
- 2296 Old Mill Rd
- 2258 Old Mill Rd
- 2668 Old Mill Rd
- 2650 Mosswood Ln
- 2238 Old Mill Rd