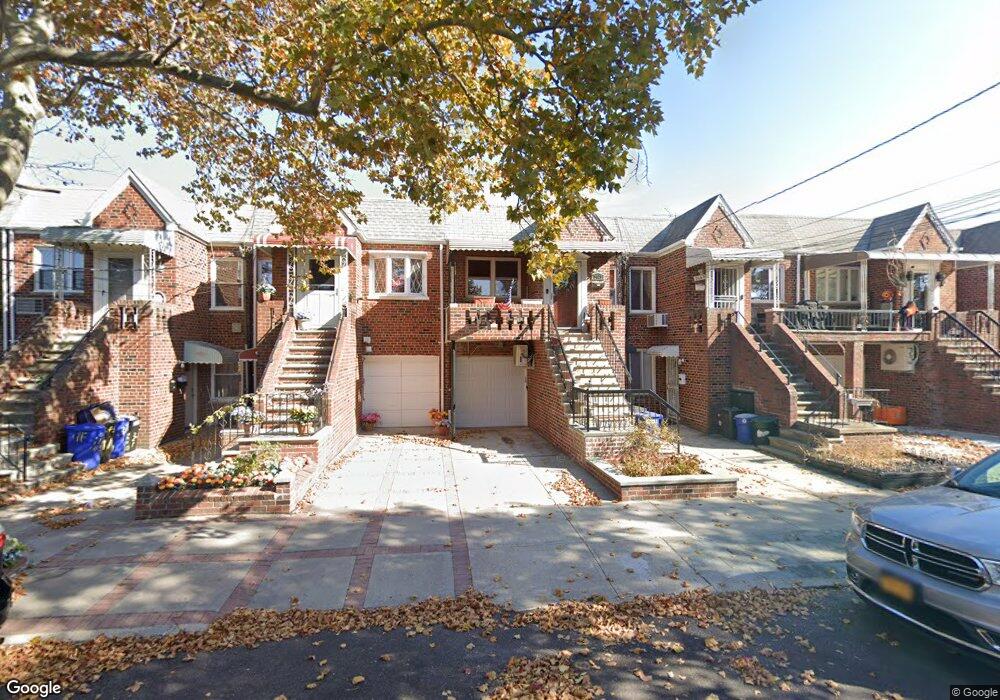
2445 Stuart St Brooklyn, NY 11229
Marine Park NeighborhoodEstimated Value: $748,000 - $981,000
Studio
--
Bath
1,660
Sq Ft
$516/Sq Ft
Est. Value
About This Home
This home is located at 2445 Stuart St, Brooklyn, NY 11229 and is currently estimated at $857,301, approximately $516 per square foot. 2445 Stuart St is a home located in Kings County with nearby schools including P.S. 277 Gerritsen Beach, J.H.S. 278 Marine Park, and New Visions Charter High School for Advanced Math/ Science.
Ownership History
Date
Name
Owned For
Owner Type
Purchase Details
Closed on
May 15, 2003
Sold by
Favuzzi Richard and Spinello Angelo
Bought by
Ecock Rachael A and Ecock Scott
Current Estimated Value
Purchase Details
Closed on
Oct 23, 1998
Sold by
Favuzzi Richard
Bought by
Favuzzi Richard and Spinello Angelo
Home Financials for this Owner
Home Financials are based on the most recent Mortgage that was taken out on this home.
Original Mortgage
$2,735
Interest Rate
6.67%
Purchase Details
Closed on
Aug 24, 1995
Sold by
Bagner Milton
Bought by
Favuzzi Richard and Spinello Angelo
Home Financials for this Owner
Home Financials are based on the most recent Mortgage that was taken out on this home.
Original Mortgage
$134,400
Interest Rate
7.8%
Create a Home Valuation Report for This Property
The Home Valuation Report is an in-depth analysis detailing your home's value as well as a comparison with similar homes in the area
Home Values in the Area
Average Home Value in this Area
Purchase History
| Date | Buyer | Sale Price | Title Company |
|---|---|---|---|
| Ecock Rachael A | $371,000 | -- | |
| Ecock Rachael A | $371,000 | -- | |
| Favuzzi Richard | -- | Commonwealth Land Title Ins | |
| Favuzzi Richard | -- | Commonwealth Land Title Ins | |
| Favuzzi Richard | $168,000 | First American Title Ins Co | |
| Favuzzi Richard | $168,000 | First American Title Ins Co |
Source: Public Records
Mortgage History
| Date | Status | Borrower | Loan Amount |
|---|---|---|---|
| Previous Owner | Favuzzi Richard | $2,735 | |
| Previous Owner | Favuzzi Richard | $134,400 | |
| Closed | Ecock Rachael A | $0 |
Source: Public Records
Tax History
| Year | Tax Paid | Tax Assessment Tax Assessment Total Assessment is a certain percentage of the fair market value that is determined by local assessors to be the total taxable value of land and additions on the property. | Land | Improvement |
|---|---|---|---|---|
| 2025 | $7,115 | $52,860 | $10,260 | $42,600 |
| 2024 | $7,115 | $48,240 | $10,260 | $37,980 |
| 2023 | $6,914 | $49,080 | $10,260 | $38,820 |
| 2022 | $6,389 | $39,360 | $10,260 | $29,100 |
| 2021 | $6,725 | $33,360 | $10,260 | $23,100 |
| 2020 | $3,166 | $39,000 | $10,260 | $28,740 |
| 2019 | $6,127 | $31,380 | $10,260 | $21,120 |
| 2018 | $5,724 | $29,539 | $8,082 | $21,457 |
| 2017 | $5,381 | $27,867 | $8,230 | $19,637 |
| 2016 | $5,261 | $27,867 | $8,022 | $19,845 |
| 2015 | $2,951 | $26,400 | $11,400 | $15,000 |
| 2014 | $2,951 | $25,574 | $11,043 | $14,531 |
Source: Public Records
Map
Nearby Homes
- 2455 Stuart St
- 2492 Gerritsen Ave
- 2355 Stuart St
- 3172 Whitney Ave
- 3168 Whitney Ave
- 3171 Whitney Ave Unit 1B
- 3171 Whitney Ave Unit 3F
- 2251 Plumb 1st St Unit 6B
- 2251 Plumb 1st St Unit 6H
- 2251 Plumb 1st St Unit 5G
- 2241 Plumb 1st St Unit 5S
- 2241 Plumb 1st St Unit 5M
- 2241 Plumb 1st St Unit 3N
- 2241 Plumb 1st St Unit 6N
- 108 Celeste Ct
- 2270 Plumb 1 St
- 2270 Plumb 1st St Unit 6H
- 2270 Plumb 1st St Unit 2D
- 2270 Plumb 1st St Unit 1B
- 2251 Knapp St Unit 5A
- 2447 Stuart St
- 2443 Stuart St
- 2449 Stuart St
- 2439 Stuart St
- 2437 Stuart St
- 2453 Stuart St
- 2453 Stuart St Unit 2
- 2435 Stuart St
- 2457 Stuart St
- 2433 Stuart St
- 2444 Burnett St
- 2450 Burnett St
- 2438 Burnett St
- 2459 Stuart St
- 2431 Stuart St
- 2454 Burnett St
- 2434 Burnett St
- 2463 Stuart St
- 2429 Stuart St
- 2460 Burnett St
Your Personal Tour Guide
Ask me questions while you tour the home.