
Seller's Agent in 2021
Molly Swan
Re/Max Of Albany
(229) 344-2268
3 in this area
105 Total Sales


Estimated Value: $274,000 - $341,000
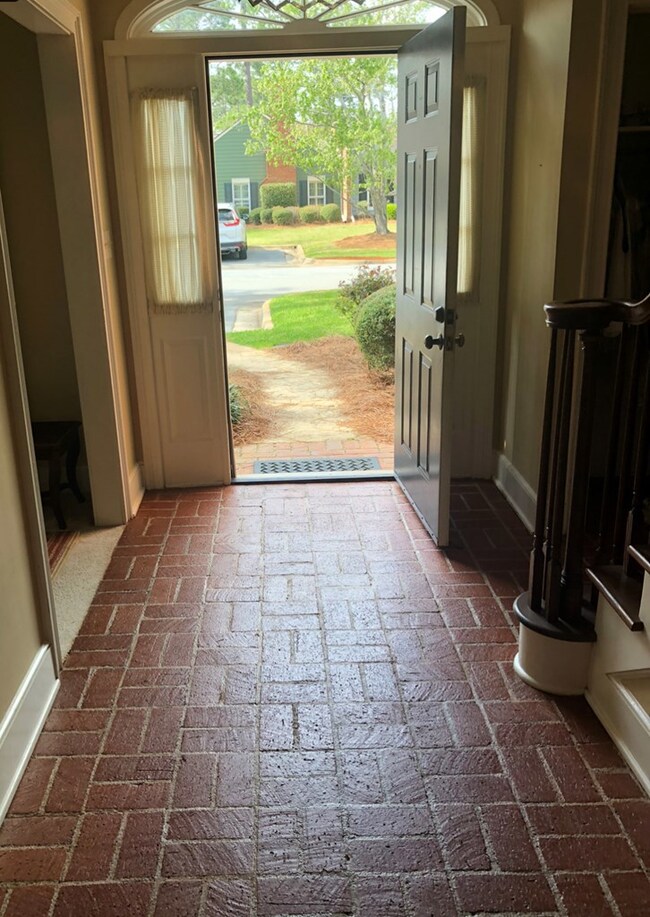
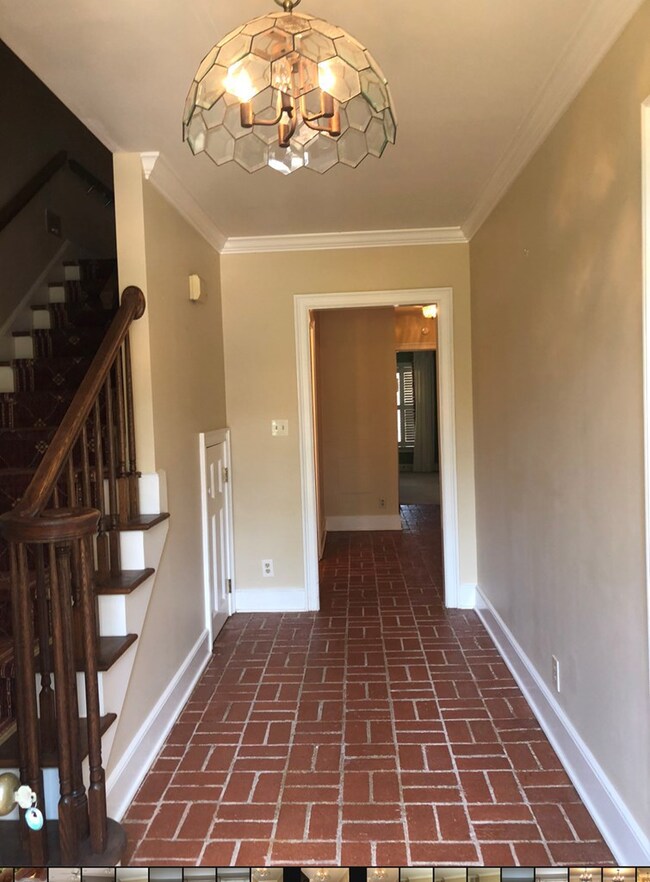
Appealing 3 BR,2.5 bath Townhome in Tuxedo Place with BRAND NEW ROOF !!!! Pretty foyer (15'5x5)with classy brick pavers / stairway at entrance. Half bath off foyer. The brick floors give extra pizazz to this condo! Great Room with carpet, bay window , built-ins and woodburning fireplace. Pretty Dining Room with brick pavers and deep crown molding. Kitchen with brick pavers,tile backsplash and black/stainless appliances,smooth top range. Nice pantry. Breakfast area that overlooks lovely courtyard with brick patio. Storage area off patio. Upstairs has two large bedrooms, with adjoining Jack 'n Jill bath. One bedroom has pine flooring , both bedrooms have fabulous closets with huge walk-ins ! CAll to view this townhome, close to everything !!!
Last Agent to Sell the Property
Re/Max Of Albany Brokerage Phone: 2294341600 License #128044 Listed on: 01/04/2021
Last Buyer's Agent
Re/Max Of Albany Brokerage Phone: 2294341600 License #128044 Listed on: 01/04/2021
| Date | Buyer | Sale Price | Title Company |
|---|---|---|---|
| Griffin Linda M | -- | -- | |
| Bonner Wallace D | $175,000 | -- | |
| Guillebeau Peggy C | $170,000 | -- | |
| Rawls Grey O | -- | -- | |
| Rawls Grey O Jr Etal | -- | -- |
| Date | Status | Borrower | Loan Amount |
|---|---|---|---|
| Previous Owner | Bonner Wallace D | $141,338 |
| Date | Event | Price | List to Sale | Price per Sq Ft |
|---|---|---|---|---|
| 01/29/2021 01/29/21 | Sold | $175,000 | -- | $85 / Sq Ft |
| 01/04/2021 01/04/21 | Pending | -- | -- | -- |
| Year | Tax Paid | Tax Assessment Tax Assessment Total Assessment is a certain percentage of the fair market value that is determined by local assessors to be the total taxable value of land and additions on the property. | Land | Improvement |
|---|---|---|---|---|
| 2024 | $3,215 | $67,388 | $3,320 | $64,068 |
| 2023 | $3,140 | $67,388 | $3,320 | $64,068 |
| 2022 | $3,151 | $67,388 | $3,320 | $64,068 |
| 2021 | $2,922 | $67,388 | $3,320 | $64,068 |
| 2020 | $2,928 | $67,388 | $3,320 | $64,068 |
| 2019 | $2,940 | $67,388 | $3,320 | $64,068 |
| 2018 | $0 | $67,388 | $3,320 | $64,068 |
| 2017 | $2,750 | $67,388 | $3,320 | $64,068 |
| 2016 | $2,751 | $67,388 | $3,320 | $64,068 |
| 2015 | -- | $67,388 | $3,320 | $64,068 |
| 2014 | $2,778 | $68,708 | $4,640 | $64,068 |
Seller's Agent in 2021
Molly Swan
Re/Max Of Albany
(229) 344-2268
3 in this area
105 Total Sales
Source: Albany Board of REALTORS®
MLS Number: 145365
APN: 301-C-00000-015