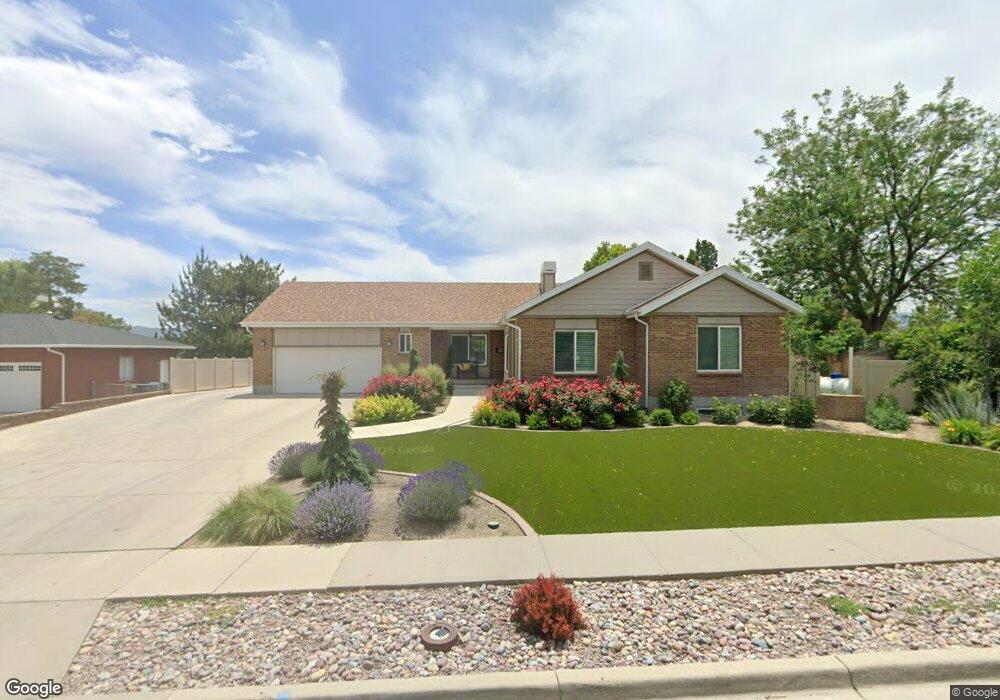
2445 W Temple View Ln South Jordan, UT 84095
Estimated Value: $745,000 - $833,352
5
Beds
3
Baths
4,068
Sq Ft
$194/Sq Ft
Est. Value
About This Home
This home is located at 2445 W Temple View Ln, South Jordan, UT 84095 and is currently estimated at $789,088, approximately $193 per square foot. 2445 W Temple View Ln is a home located in Salt Lake County with nearby schools including Jordan Ridge School, South Jordan Middle School, and Hawthorn Academy.
Ownership History
Date
Name
Owned For
Owner Type
Purchase Details
Closed on
Dec 7, 2023
Sold by
Agreement With The Andrew & Kerrie Bench
Bought by
Bench Family Trust and Bench
Current Estimated Value
Purchase Details
Closed on
Dec 15, 2010
Sold by
Bench Andrew B and Bench Kerrie
Bought by
Bench Kerrie M
Purchase Details
Closed on
May 27, 2010
Sold by
Bench Kerrie M
Bought by
Bench Andrew B and Bench Kerrie
Purchase Details
Closed on
Dec 10, 2008
Sold by
Bench Andrew B and Bench Kerri
Bought by
Bench Kerrie M
Purchase Details
Closed on
Aug 15, 2007
Sold by
Christensen John Darrell and Christensen Jerri G
Bought by
Bench Andrew B and Bench Kerrie
Home Financials for this Owner
Home Financials are based on the most recent Mortgage that was taken out on this home.
Original Mortgage
$349,500
Interest Rate
6.62%
Mortgage Type
Purchase Money Mortgage
Create a Home Valuation Report for This Property
The Home Valuation Report is an in-depth analysis detailing your home's value as well as a comparison with similar homes in the area
Home Values in the Area
Average Home Value in this Area
Purchase History
| Date | Buyer | Sale Price | Title Company |
|---|---|---|---|
| Bench Family Trust | -- | None Listed On Document | |
| Bench Kerrie M | -- | Richland Title Ins Agency In | |
| Bench Andrew B | -- | Richland Title Ins Agency In | |
| Bench Kerrie M | -- | Richland Title Ins Agency In | |
| Bench Andrew B | -- | First American Title |
Source: Public Records
Mortgage History
| Date | Status | Borrower | Loan Amount |
|---|---|---|---|
| Previous Owner | Bench Andrew B | $349,500 |
Source: Public Records
Tax History Compared to Growth
Tax History
| Year | Tax Paid | Tax Assessment Tax Assessment Total Assessment is a certain percentage of the fair market value that is determined by local assessors to be the total taxable value of land and additions on the property. | Land | Improvement |
|---|---|---|---|---|
| 2025 | $3,668 | $747,800 | $244,200 | $503,600 |
| 2024 | $3,668 | $696,400 | $237,300 | $459,100 |
| 2023 | $3,502 | $627,300 | $234,900 | $392,400 |
| 2022 | $3,659 | $642,500 | $230,300 | $412,200 |
| 2021 | $2,899 | $467,000 | $177,200 | $289,800 |
| 2020 | $2,799 | $422,700 | $177,200 | $245,500 |
| 2019 | $2,762 | $410,000 | $138,200 | $271,800 |
| 2018 | $2,591 | $382,700 | $138,200 | $244,500 |
| 2017 | $2,493 | $360,800 | $138,200 | $222,600 |
| 2016 | $2,493 | $341,900 | $138,200 | $203,700 |
| 2015 | $2,358 | $314,500 | $148,100 | $166,400 |
| 2014 | $2,252 | $295,200 | $140,600 | $154,600 |
Source: Public Records
Map
Nearby Homes
- 2343 Temple View Cir
- 2375 Bonanza Way
- 10366 S 2200 W
- 6977 W Hidden Way S Unit 147
- 10320 S 2700 W
- 2439 Bridle Oak Dr
- 10543 S 2330 W
- 2167 W Amber Blossom Way
- 2551 W Winding Way
- 2777 W Urban Ridge Rd
- 2246 Country Bend Dr Unit 25
- 10177 Statesman Place
- 10804 S Haven Landing Dr
- 10838 S Haven Landing Dr
- 2908 W Bison Ridge Rd
- 10749 S 2200 W
- 1553 W Banner Dr Unit 844
- 1891 Orchard View Cir
- 1578 W Banner Dr Unit 745
- 1558 W Banner Dr Unit 805
- 2445 Temple View Ln
- 2427 Temple View Ln
- 2409 Temple View Ln
- 2438 W Temple View Ln
- 2438 Temple View Ln
- 2391 Temple View Ln
- 2410 Temple View Ln
- 2410 W Temple View Ln
- 2384 Temple View Ln
- 10317 S Cherry Grove Way
- 10317 Cherry Grove Way
- 2389 W Bonanza Ct
- 10254 Temple View Cir
- 10254 Temple View Cir Unit 18
- 10244 S Temple View Cir
- 2488 Cherry Grove Way
- 10274 Temple View Cir
- 10274 S Temple View Cir Unit 17
- 10327 Cherry Grove Way
- 10288 Temple View Cir