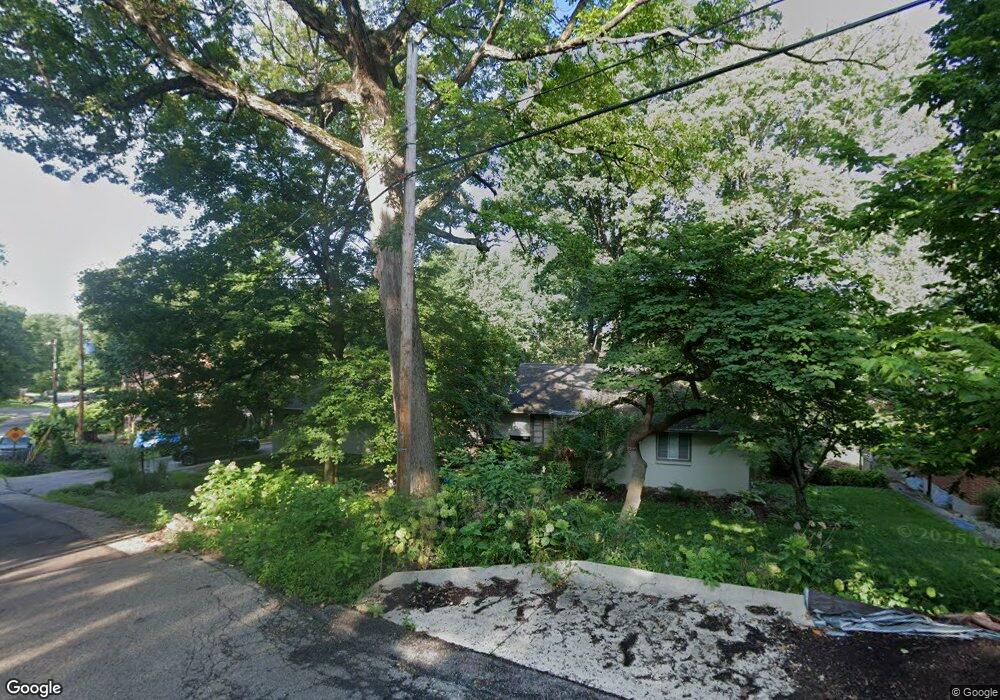
2447 Adirondack Trail Dayton, OH 45409
Estimated Value: $293,000 - $340,000
3
Beds
2
Baths
1,448
Sq Ft
$219/Sq Ft
Est. Value
About This Home
This home is located at 2447 Adirondack Trail, Dayton, OH 45409 and is currently estimated at $317,530, approximately $219 per square foot. 2447 Adirondack Trail is a home located in Montgomery County with nearby schools including Southdale Elementary School, Van Buren Middle School, and Kettering Fairmont High School.
Ownership History
Date
Name
Owned For
Owner Type
Purchase Details
Closed on
Dec 11, 2017
Sold by
Marinetti Laureen J
Bought by
Clouser Shelby R and Sommer Timothy
Current Estimated Value
Home Financials for this Owner
Home Financials are based on the most recent Mortgage that was taken out on this home.
Original Mortgage
$180,500
Outstanding Balance
$151,965
Interest Rate
3.94%
Mortgage Type
New Conventional
Estimated Equity
$165,565
Purchase Details
Closed on
Nov 29, 2007
Sold by
Kurpe Richard L and Kurpe Marie T
Bought by
Marinetti Laureen J
Home Financials for this Owner
Home Financials are based on the most recent Mortgage that was taken out on this home.
Original Mortgage
$204,250
Interest Rate
6.33%
Mortgage Type
Purchase Money Mortgage
Purchase Details
Closed on
Dec 30, 1997
Sold by
Kurpe Richard L and Kurpe Marie T
Bought by
Kurpe Richard L and Kurpe Marie T
Create a Home Valuation Report for This Property
The Home Valuation Report is an in-depth analysis detailing your home's value as well as a comparison with similar homes in the area
Home Values in the Area
Average Home Value in this Area
Purchase History
| Date | Buyer | Sale Price | Title Company |
|---|---|---|---|
| Clouser Shelby R | $177,500 | Home Services Title Llc | |
| Marinetti Laureen J | $215,000 | Attorney | |
| Kurpe Richard L | -- | -- | |
| Kurpe Richard L | -- | -- |
Source: Public Records
Mortgage History
| Date | Status | Borrower | Loan Amount |
|---|---|---|---|
| Open | Clouser Shelby R | $180,500 | |
| Previous Owner | Marinetti Laureen J | $204,250 |
Source: Public Records
Tax History Compared to Growth
Tax History
| Year | Tax Paid | Tax Assessment Tax Assessment Total Assessment is a certain percentage of the fair market value that is determined by local assessors to be the total taxable value of land and additions on the property. | Land | Improvement |
|---|---|---|---|---|
| 2024 | $5,350 | $86,360 | $25,270 | $61,090 |
| 2023 | $5,350 | $86,360 | $25,270 | $61,090 |
| 2022 | $4,964 | $63,360 | $18,590 | $44,770 |
| 2021 | $4,590 | $63,360 | $18,590 | $44,770 |
| 2020 | $4,607 | $63,360 | $18,590 | $44,770 |
| 2019 | $5,445 | $66,310 | $16,890 | $49,420 |
| 2018 | $5,475 | $66,310 | $16,890 | $49,420 |
| 2017 | $5,041 | $66,310 | $16,890 | $49,420 |
| 2016 | $4,855 | $60,010 | $16,890 | $43,120 |
| 2015 | $4,638 | $60,010 | $16,890 | $43,120 |
| 2014 | $4,638 | $60,010 | $16,890 | $43,120 |
| 2012 | -- | $75,030 | $19,140 | $55,890 |
Source: Public Records
Map
Nearby Homes
- 1473 Constance Ave Unit 1481
- 1420 Adirondack Trail
- 2467 S Dixie Dr
- 1536 Old Lane Ave
- 1597 Old Lane Ave
- 2230 S Patterson Blvd
- 1615 Carrollton Ave
- 1211 Runnymede Rd
- 1545 Cardington Rd
- 1160 Waving Willow Dr
- 1364 Elmdale Dr
- 1424 Elmdale Dr
- 1554 Crescent Blvd
- 1129 W Dorothy Ln
- 447 Kramer Rd
- 1500 Ridgeway Rd
- 3060 Regent St
- 116 Thruston Blvd W
- 200 Maysfield Rd
- 51 Forrer Rd
- 2441 Adirondack Trail
- 2433 Adirondack Trail
- 2512 S Patterson Blvd
- 2520 S Patterson Blvd
- 2508 S Patterson Blvd
- 2429 Adirondack Trail
- 2524 S Patterson Blvd
- 2504 S Patterson Blvd
- 2520 Evelyn Dr
- 2500 S Patterson Blvd
- 2550 S Patterson Blvd
- 2501 Adirondack Trail
- 2434 Adirondack Trail
- 2520 Adirondack Trail
- 2476 S Patterson Blvd
- 2421 Adirondack Trail
- 2558 S Patterson Blvd
- 2468 S Patterson Blvd
- 2566 S Patterson Blvd
- 2509 Adirondack Trail