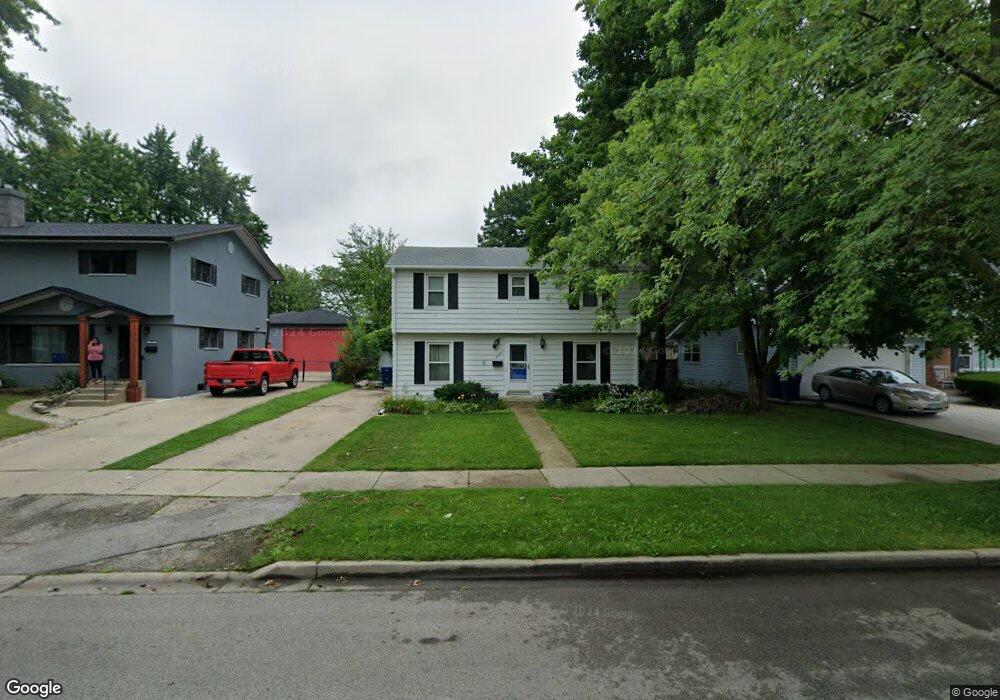
2447 Chestnut St Waukegan, IL 60087
Marquette Highlands NeighborhoodEstimated Value: $240,238 - $257,000
3
Beds
2
Baths
1,353
Sq Ft
$185/Sq Ft
Est. Value
About This Home
This home is located at 2447 Chestnut St, Waukegan, IL 60087 and is currently estimated at $250,810, approximately $185 per square foot. 2447 Chestnut St is a home located in Lake County with nearby schools including John S. Clark Elementary School, Jack Benny Middle School, and Waukegan High School.
Ownership History
Date
Name
Owned For
Owner Type
Purchase Details
Closed on
May 26, 2011
Sold by
Gonzalez David R and Gonzalez Anne M
Bought by
Murray Ryan J and Murray Megan
Current Estimated Value
Home Financials for this Owner
Home Financials are based on the most recent Mortgage that was taken out on this home.
Original Mortgage
$70,000
Outstanding Balance
$48,347
Interest Rate
4.67%
Mortgage Type
New Conventional
Estimated Equity
$202,463
Purchase Details
Closed on
Jul 2, 2002
Sold by
Losch William C
Bought by
Gonzalez David R and Gonzalez Anne M
Home Financials for this Owner
Home Financials are based on the most recent Mortgage that was taken out on this home.
Original Mortgage
$134,105
Interest Rate
6.32%
Mortgage Type
FHA
Purchase Details
Closed on
Jan 31, 2000
Sold by
Losch Susan B
Bought by
Losch William C
Create a Home Valuation Report for This Property
The Home Valuation Report is an in-depth analysis detailing your home's value as well as a comparison with similar homes in the area
Home Values in the Area
Average Home Value in this Area
Purchase History
| Date | Buyer | Sale Price | Title Company |
|---|---|---|---|
| Murray Ryan J | $112,000 | Chicago Title Insurance Co | |
| Gonzalez David R | $136,000 | -- | |
| Losch William C | -- | -- |
Source: Public Records
Mortgage History
| Date | Status | Borrower | Loan Amount |
|---|---|---|---|
| Open | Murray Ryan J | $70,000 | |
| Previous Owner | Gonzalez David R | $134,105 |
Source: Public Records
Tax History Compared to Growth
Tax History
| Year | Tax Paid | Tax Assessment Tax Assessment Total Assessment is a certain percentage of the fair market value that is determined by local assessors to be the total taxable value of land and additions on the property. | Land | Improvement |
|---|---|---|---|---|
| 2024 | $4,508 | $61,851 | $13,743 | $48,108 |
| 2023 | $4,566 | $55,812 | $12,402 | $43,410 |
| 2022 | $4,566 | $52,707 | $10,735 | $41,972 |
| 2021 | $4,618 | $50,295 | $9,576 | $40,719 |
| 2020 | $4,631 | $46,856 | $8,921 | $37,935 |
| 2019 | $4,608 | $42,936 | $8,175 | $34,761 |
| 2018 | $4,127 | $38,303 | $11,570 | $26,733 |
| 2017 | $3,997 | $33,887 | $10,236 | $23,651 |
| 2016 | $3,623 | $29,447 | $8,895 | $20,552 |
| 2015 | $3,438 | $26,355 | $7,961 | $18,394 |
| 2014 | $3,443 | $25,887 | $7,667 | $18,220 |
| 2012 | $4,487 | $28,046 | $8,306 | $19,740 |
Source: Public Records
Map
Nearby Homes
- 301 W Eagle Ct
- 2232 Walnut St
- 0 Traditions Dr
- 1612 Whitney St
- 2246 Alta Vista Dr
- 1905 Linden Ave
- 2213 Alta Vista Dr
- 2613 N Lewis Ave
- 2350 N Lewis Ave
- 1636 Rice St
- 37231 N Ganster Rd
- 10241 W Bairstow Ave
- 616 W Keith Ave
- 1018 W Atlantic Ave
- 37905 N Loyola Ave
- 1336 N Ash St
- 1335 Chestnut St
- 37789 N Sheridan Rd
- 38362 N Manor Ave
- 37966 N Cornell Rd
- 2439 Chestnut St
- 2501 Chestnut St
- 2435 Chestnut St
- 2440 N Poplar St
- 2507 Chestnut St
- 2450 N Poplar St
- 2431 Chestnut St
- 2502 N Poplar St
- 2444 Chestnut St
- 2448 Chestnut St
- 2430 N Poplar St
- 2511 Chestnut St
- 2440 Chestnut St
- 2502 Chestnut St
- 2436 Chestnut St
- 2512 N Poplar St
- 2427 Chestnut St
- 2512 Chestnut St
- 2515 Chestnut St
- 2426 N Poplar St