2447 Midway St Alexandria, LA 71301
Estimated Value: $56,000 - $63,998
3
Beds
1
Bath
1,200
Sq Ft
$49/Sq Ft
Est. Value
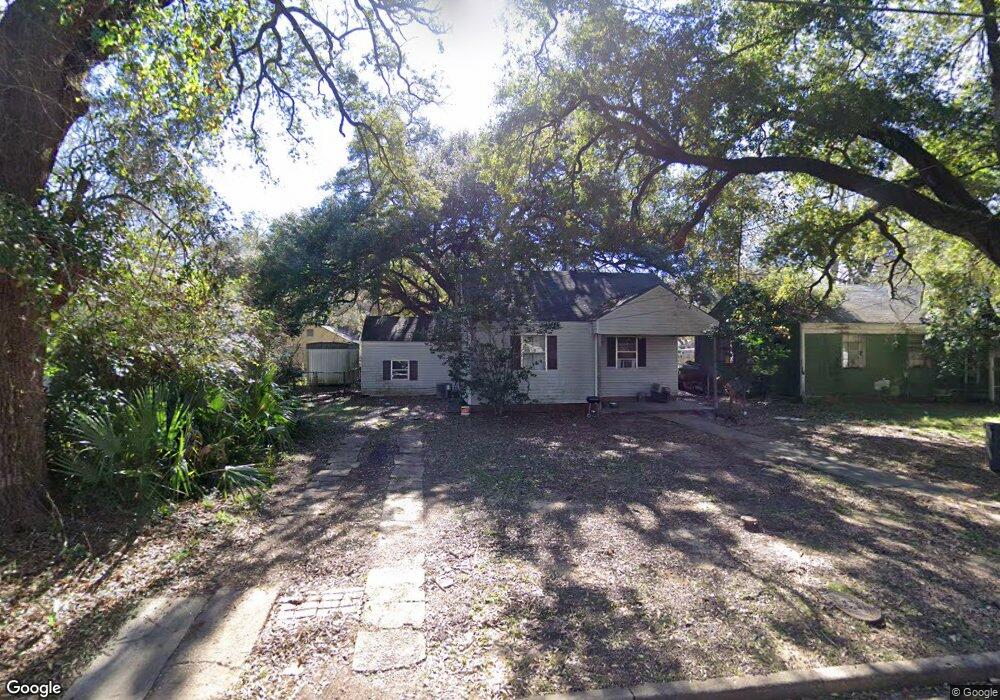
About This Home
This home is located at 2447 Midway St, Alexandria, LA 71301 and is currently estimated at $59,000, approximately $49 per square foot. 2447 Midway St is a home located in Rapides Parish with nearby schools including D.F. Huddle Elementary School, Alexandria Middle Magnet School, and Bolton High School.
Ownership History
Date
Name
Owned For
Owner Type
Purchase Details
Closed on
Jun 29, 2022
Sold by
Heider Hebert Frances Marie
Bought by
Broken Arrow Investments Llc
Current Estimated Value
Purchase Details
Closed on
Jan 29, 2005
Sold by
Loewer Hoyt Friedrich and Loewer Dawn Dail
Bought by
Abm Properties Inc
Home Financials for this Owner
Home Financials are based on the most recent Mortgage that was taken out on this home.
Original Mortgage
$26,000
Interest Rate
5.85%
Mortgage Type
Credit Line Revolving
Create a Home Valuation Report for This Property
The Home Valuation Report is an in-depth analysis detailing your home's value as well as a comparison with similar homes in the area
Home Values in the Area
Average Home Value in this Area
Purchase History
| Date | Buyer | Sale Price | Title Company |
|---|---|---|---|
| Broken Arrow Investments Llc | -- | None Listed On Document | |
| Abm Properties Inc | $20,000 | None Available |
Source: Public Records
Mortgage History
| Date | Status | Borrower | Loan Amount |
|---|---|---|---|
| Previous Owner | Abm Properties Inc | $26,000 |
Source: Public Records
Tax History Compared to Growth
Tax History
| Year | Tax Paid | Tax Assessment Tax Assessment Total Assessment is a certain percentage of the fair market value that is determined by local assessors to be the total taxable value of land and additions on the property. | Land | Improvement |
|---|---|---|---|---|
| 2024 | $275 | $3,000 | $400 | $2,600 |
| 2023 | $278 | $3,000 | $400 | $2,600 |
| 2022 | $354 | $3,000 | $400 | $2,600 |
| 2021 | $305 | $3,000 | $400 | $2,600 |
| 2020 | $305 | $3,000 | $400 | $2,600 |
| 2019 | $231 | $3,000 | $400 | $2,600 |
| 2018 | $257 | $3,000 | $400 | $2,600 |
| 2017 | $258 | $3,000 | $400 | $2,600 |
| 2016 | $333 | $3,000 | $400 | $2,600 |
| 2015 | $334 | $3,015 | $400 | $2,615 |
| 2014 | $335 | $3,015 | $400 | $2,615 |
| 2013 | $321 | $3,015 | $400 | $2,615 |
Source: Public Records
Map
Nearby Homes