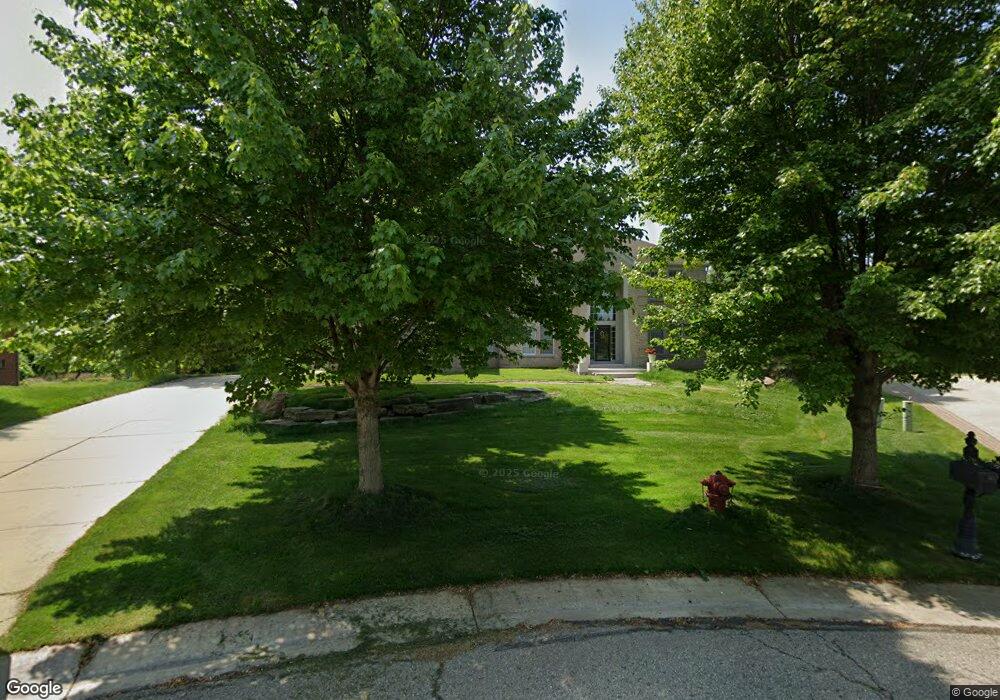
2447 Selkirk Ct Unit Bldg-Unit Rochester, MI 48306
Estimated Value: $938,000 - $1,060,000
4
Beds
6
Baths
3,834
Sq Ft
$258/Sq Ft
Est. Value
About This Home
This home is located at 2447 Selkirk Ct Unit Bldg-Unit, Rochester, MI 48306 and is currently estimated at $990,107, approximately $258 per square foot. 2447 Selkirk Ct Unit Bldg-Unit is a home located in Oakland County with nearby schools including Delta Kelly Elementary School, Van Hoosen Middle School, and Rochester Adams High School.
Ownership History
Date
Name
Owned For
Owner Type
Purchase Details
Closed on
Oct 26, 2018
Sold by
Wagner Karl R and Wagner Birgit
Bought by
Bhatti Waseem
Current Estimated Value
Home Financials for this Owner
Home Financials are based on the most recent Mortgage that was taken out on this home.
Original Mortgage
$492,000
Outstanding Balance
$428,746
Interest Rate
4.37%
Mortgage Type
Adjustable Rate Mortgage/ARM
Estimated Equity
$561,361
Purchase Details
Closed on
Oct 18, 2013
Sold by
Quinlan Kevin and Quinlan Jennifer
Bought by
Wagner Karl R and Wagner Birgit
Purchase Details
Closed on
Nov 2, 2009
Sold by
Gallagher James S and Gallagher Amy S
Bought by
Quinlan Kevin and Quinlan Jennifer
Purchase Details
Closed on
Jul 25, 2003
Sold by
Pulte Land Co Llc
Bought by
Gallagher James S and Gallagher Amy S
Create a Home Valuation Report for This Property
The Home Valuation Report is an in-depth analysis detailing your home's value as well as a comparison with similar homes in the area
Home Values in the Area
Average Home Value in this Area
Purchase History
| Date | Buyer | Sale Price | Title Company |
|---|---|---|---|
| Bhatti Waseem | $615,000 | None Available | |
| Wagner Karl R | $630,000 | None Available | |
| Quinlan Kevin | $445,000 | Title One Inc | |
| Gallagher James S | $190,000 | Metropolitan Title Company |
Source: Public Records
Mortgage History
| Date | Status | Borrower | Loan Amount |
|---|---|---|---|
| Open | Bhatti Waseem | $492,000 |
Source: Public Records
Tax History Compared to Growth
Tax History
| Year | Tax Paid | Tax Assessment Tax Assessment Total Assessment is a certain percentage of the fair market value that is determined by local assessors to be the total taxable value of land and additions on the property. | Land | Improvement |
|---|---|---|---|---|
| 2024 | $5,824 | $391,450 | $0 | $0 |
| 2023 | $5,600 | $350,240 | $0 | $0 |
| 2022 | $8,298 | $337,600 | $0 | $0 |
| 2021 | $7,757 | $325,260 | $0 | $0 |
| 2020 | $5,410 | $313,630 | $0 | $0 |
| 2019 | $8,282 | $312,320 | $0 | $0 |
| 2018 | $8,289 | $310,210 | $0 | $0 |
| 2017 | $8,156 | $305,350 | $0 | $0 |
| 2016 | $8,113 | $302,830 | $0 | $0 |
| 2015 | -- | $298,140 | $0 | $0 |
| 2014 | -- | $289,500 | $0 | $0 |
| 2011 | -- | $216,710 | $0 | $0 |
Source: Public Records
Map
Nearby Homes
- 5466 Orchard Ridge Dr
- 5350 Brewster Rd
- 5826 Murfield Dr
- 1938 Kilburn Rd N
- 2750 Castlemartin Ct Unit 22
- 0000 Silver Bell Rd
- 1701 Silver Bell Rd
- 2879 Hastings Ct Unit 73
- 2935 Woodford Cir
- 3185 Saint James Ct
- 1513 Lomas Verdes
- 4831 Goodison Place Dr
- 1515 Chevy Circuit
- 1609 Kilburn Rd N
- 1811 Blue Grass Dr
- 4740 Pinnacle Blvd
- 4701 Pinnacle Blvd
- 4683 Pinnacle Blvd
- 4512 Pinnacle Blvd
- 4554 Pinnacle Blvd
- 2447 Selkirk Ct
- 2431 Selkirk Ct
- 2463 Selkirk Ct
- 2415 Selkirk Ct
- 2462 Selkirk Ct
- 2440 Selkirk Ct
- 2399 Selkirk Ct
- 5675 Brewster Rd
- 2382 Selkirk Ct
- 5689 Carrollton Ct
- 5825 Brewster Rd
- 2383 Selkirk Ct
- 5620 Stonehaven Blvd
- 5639 Carrollton Ct
- 2445 Andover Blvd
- 5739 Carrollton Ct
- 5589 Carrollton Ct
- 2457 Andover Blvd
- 5642 Stonehaven Blvd