2448 E Pleasant Home Rd Creston, OH 44217
Estimated Value: $1,042,000
3
Beds
1
Bath
2,040
Sq Ft
$511/Sq Ft
Est. Value
About This Home
This home is located at 2448 E Pleasant Home Rd, Creston, OH 44217 and is currently priced at $1,042,000, approximately $510 per square foot. 2448 E Pleasant Home Rd is a home located in Wayne County with nearby schools including Norwayne Elementary School, Norwayne Middle School, and Norwayne High School.
Ownership History
Date
Name
Owned For
Owner Type
Purchase Details
Closed on
Jul 25, 2017
Sold by
Hermanville Properties Llc
Bought by
Wise Andrew E
Current Estimated Value
Home Financials for this Owner
Home Financials are based on the most recent Mortgage that was taken out on this home.
Original Mortgage
$128,000
Outstanding Balance
$106,405
Interest Rate
3.91%
Mortgage Type
New Conventional
Purchase Details
Closed on
Apr 25, 2017
Sold by
Sheets Wilbur and Garrison Jo Ann
Bought by
Hermanville Properties Llc
Home Financials for this Owner
Home Financials are based on the most recent Mortgage that was taken out on this home.
Original Mortgage
$900,500
Interest Rate
4.3%
Mortgage Type
Commercial
Purchase Details
Closed on
Feb 12, 2016
Home Financials for this Owner
Home Financials are based on the most recent Mortgage that was taken out on this home.
Interest Rate
3.65%
Purchase Details
Closed on
Jan 1, 1987
Bought by
Elliston Rex and Elliston Geneviev
Create a Home Valuation Report for This Property
The Home Valuation Report is an in-depth analysis detailing your home's value as well as a comparison with similar homes in the area
Home Values in the Area
Average Home Value in this Area
Purchase History
| Date | Buyer | Sale Price | Title Company |
|---|---|---|---|
| Wise Andrew E | $160,000 | None Available | |
| Hermanville Properties Llc | $1,060,500 | None Available | |
| -- | -- | -- | |
| Elliston Rex | -- | -- |
Source: Public Records
Mortgage History
| Date | Status | Borrower | Loan Amount |
|---|---|---|---|
| Open | Wise Andrew E | $128,000 | |
| Previous Owner | Hermanville Properties Llc | $900,500 | |
| Previous Owner | -- | -- |
Source: Public Records
Tax History Compared to Growth
Tax History
| Year | Tax Paid | Tax Assessment Tax Assessment Total Assessment is a certain percentage of the fair market value that is determined by local assessors to be the total taxable value of land and additions on the property. | Land | Improvement |
|---|---|---|---|---|
| 2024 | $1,763 | $339,820 | $339,820 | $0 |
| 2023 | $1,763 | $339,820 | $339,820 | $0 |
| 2022 | $563 | $339,820 | $339,820 | $0 |
| 2021 | $587 | $339,820 | $339,820 | $0 |
| 2020 | $593 | $339,820 | $339,820 | $0 |
| 2019 | $1,330 | $292,250 | $292,250 | $0 |
| 2018 | $1,337 | $292,250 | $292,250 | $0 |
| 2017 | $1,294 | $292,250 | $292,250 | $0 |
| 2016 | $2,744 | $154,270 | $126,860 | $27,410 |
| 2015 | $2,707 | $154,270 | $126,860 | $27,410 |
| 2014 | $2,736 | $154,270 | $126,860 | $27,410 |
| 2013 | $2,023 | $106,640 | $75,400 | $31,240 |
Source: Public Records
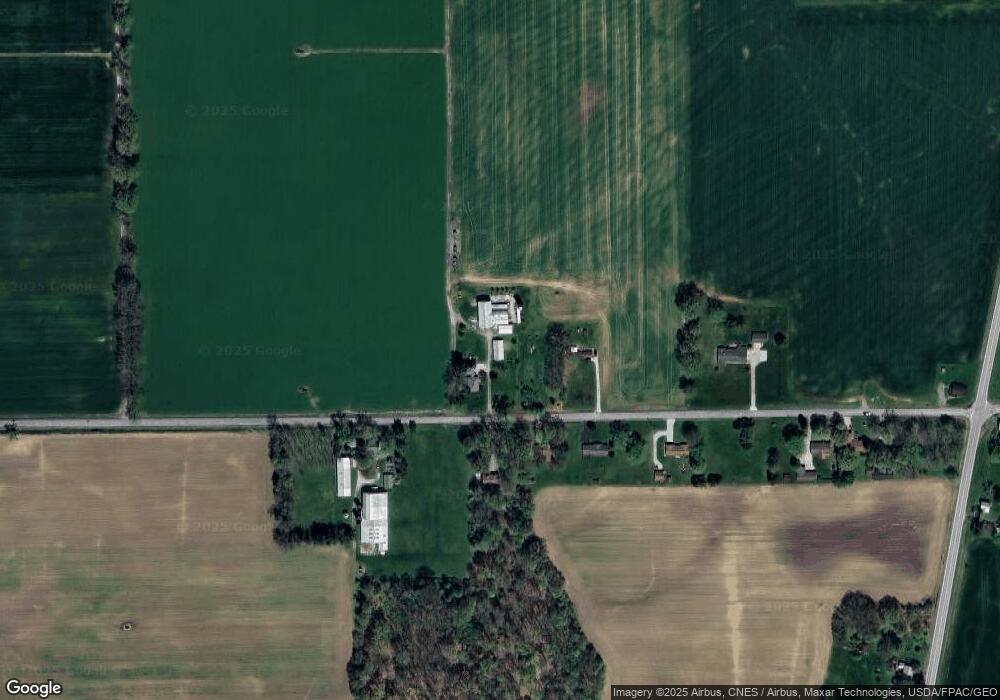
Map
Nearby Homes
- 2588 Fulton Rd
- 1457 Fox Lake Rd
- 11387 Canaan Center Rd
- 7210 Cleveland Rd
- 11835 Canaan Center Rd
- 2710 E Hutton Rd
- 7190 N Geyers Chapel Rd
- 6294 Hoffman Rd
- 5974 Cleveland Rd Unit 23
- 4156 Fieldridge Ct
- 2330 Schellin Rd
- 2359 Schellin Rd
- 12567 Eby Rd
- 888 Flag Stone Ave
- 10575 Burbank Rd
- 6471 Easton Rd
- 4957 Oasis Ave
- 2082 E Prosperity Way
- 2068 Prosperity Way
- 2058 Prosperity Way
- 2495 E Pleasant Home Rd
- 2525 E Pleasant Home Rd
- 2381 E Pleasant Home Rd
- 2579 E Pleasant Home Rd
- 2612 E Pleasant Home Rd
- 2669 E Pleasant Home Rd
- 2691 E Pleasant Home Rd
- 2715 E Pleasant Home Rd
- 2750 E Pleasant Home Rd
- 9581 Cleveland Rd
- 9424 Cleveland Rd
- 9300 Cleveland Rd
- 9874 Cleveland Rd
- 2095 E Pleasant Home Rd
- 10298 Cleveland Rd
- 10296 Cleveland Rd
- 9226 Cleveland Rd
- 2003 E Pleasant Home Rd
- 9208 Cleveland Rd
- 2959 E Pleasant Home Rd