Estimated Value: $164,380 - $205,000
Studio
--
Bath
1,216
Sq Ft
$150/Sq Ft
Est. Value
About This Home
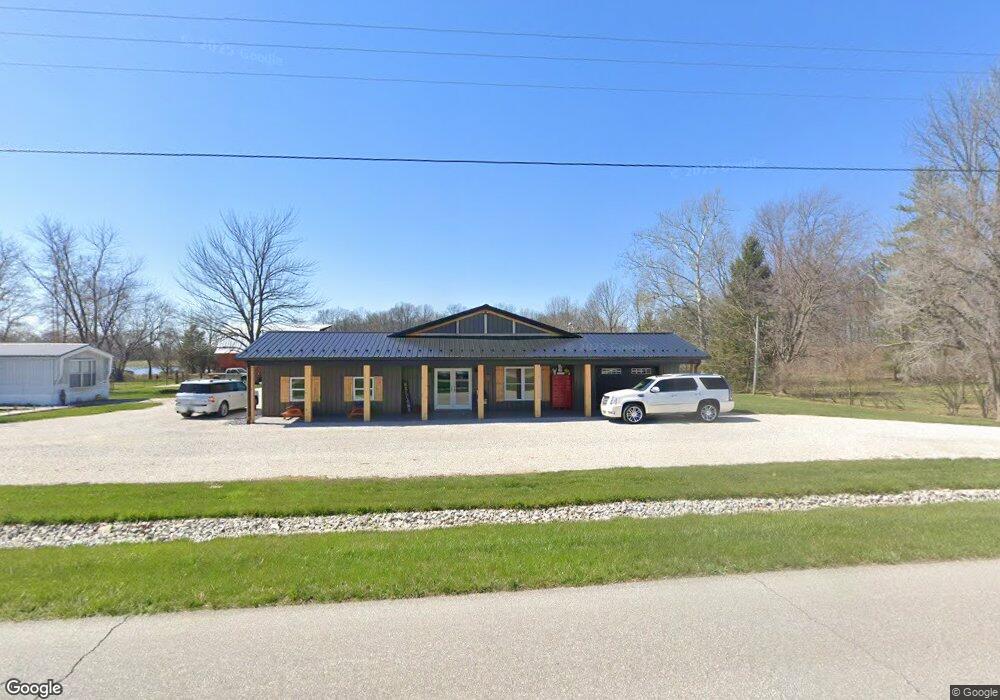
This home is located at 2448 N Old 56, Salem, IN 47167 and is currently estimated at $181,845, approximately $149 per square foot. 2448 N Old 56 is a home with nearby schools including Bradie M. Shrum Lower Elementary School, Salem Middle School, and Salem High School.
Ownership History
Date
Name
Owned For
Owner Type
Purchase Details
Closed on
Feb 28, 2020
Sold by
Vermillion Eric and Cheatham Kristy L
Bought by
White Travis and White Charlee
Current Estimated Value
Home Financials for this Owner
Home Financials are based on the most recent Mortgage that was taken out on this home.
Original Mortgage
$120,000
Outstanding Balance
$104,730
Interest Rate
5.75%
Mortgage Type
New Conventional
Estimated Equity
$77,115
Purchase Details
Closed on
Jul 9, 2019
Sold by
Vermillion Eric A and Cheatham Kirsty L
Bought by
White Travis and White Charlee
Purchase Details
Closed on
May 17, 2016
Sold by
Dixon Jeffrey K and Dixon Loretta J
Bought by
Vermillion Eric and Cheatham Kristy L
Home Financials for this Owner
Home Financials are based on the most recent Mortgage that was taken out on this home.
Original Mortgage
$38,907
Interest Rate
3.59%
Mortgage Type
Commercial
Purchase Details
Closed on
Aug 18, 2009
Sold by
Walters Joseph L and Walters Lori Lee
Bought by
Dixon Jeffrey K and Dixon Loretta J
Create a Home Valuation Report for This Property
The Home Valuation Report is an in-depth analysis detailing your home's value as well as a comparison with similar homes in the area
Purchase History
We collect this data history from publicly available records. To have your information removed, we recommend requesting removal directly through your county’s website.
| Date | Buyer | Sale Price | Title Company |
|---|---|---|---|
| White Travis | $65,000 | Heinz Law Office, Llc | |
| White Travis | -- | None Available | |
| Vermillion Eric | -- | None Available | |
| Dixon Jeffrey K | -- | None Available |
Source: Public Records
Mortgage History
We collect this data history from publicly available records. To have your information removed, we recommend requesting removal directly through your county’s website.
| Date | Status | Borrower | Loan Amount |
|---|---|---|---|
| Open | White Travis | $120,000 | |
| Previous Owner | Vermillion Eric | $38,907 |
Source: Public Records
Tax History
| Year | Tax Paid | Tax Assessment Tax Assessment Total Assessment is a certain percentage of the fair market value that is determined by local assessors to be the total taxable value of land and additions on the property. | Land | Improvement |
|---|---|---|---|---|
| 2025 | $1,808 | $115,800 | $18,800 | $97,000 |
| 2024 | $1,808 | $92,100 | $18,800 | $73,300 |
| 2023 | $2,119 | $103,300 | $18,800 | $84,500 |
| 2022 | $2,068 | $104,200 | $18,800 | $85,400 |
| 2021 | $2,187 | $97,100 | $18,800 | $78,300 |
| 2020 | $2,088 | $104,400 | $18,800 | $85,600 |
| 2019 | $830 | $41,500 | $18,800 | $22,700 |
| 2018 | $794 | $39,700 | $18,800 | $20,900 |
| 2017 | $125 | $39,700 | $18,800 | $20,900 |
| 2016 | $104 | $39,400 | $18,800 | $20,600 |
| 2014 | $719 | $40,600 | $18,800 | $21,800 |
| 2013 | $694 | $38,100 | $19,100 | $19,000 |
Source: Public Records
Map
Nearby Homes
- 5881 E Old 56
- 6155 E State Road 56
- 4313 E Canton Rd
- 2034 N Naugle Rd
- 1971 N Naugle Rd
- 115 N Harristown Rd
- 2448 N Leval Ratt Rd
- E E Old 56 Unit 4
- N Side N Leval Ratt Rd
- 00 N Side N Leval Ratt Rd
- TBD E Old St Rd 56
- 1706 E Lewellen Rd
- 130 E Eastern Hills Blvd
- S S 160
- 705 N Heritage Chapel Tract 2 Rd
- 8144 E Old State Road 56
- 0 E Old State Road 56
- 532 Pilgrim Way
- 107 Walker Blvd
- 506 Pilgrim Way
- 5019 E Firetower Rd
- 5155 E State Road 56
- 5020 E Firetower Rd
- 5140 E Old 56
- 2602 N Old Hwy 56
- 5048 E Firetower Rd
- 5267 E Old 56
- 4950 E State Road 56
- 5147 E State Road 56
- 5176 E Firetower Rd
- 5220 E Egger Rd
- 2706 N Old 56
- 2706 N Old 56
- 5309 E Firetower Rd
- 5180 E Firetower Rd
- 5186 E Fire Tower Rd
- 5186 E Firetower Rd
- 4875 E State Road 56
- 5184 E Firetower Rd
- 2786 N Old 56
Your Personal Tour Guide
Ask me questions while you tour the home.