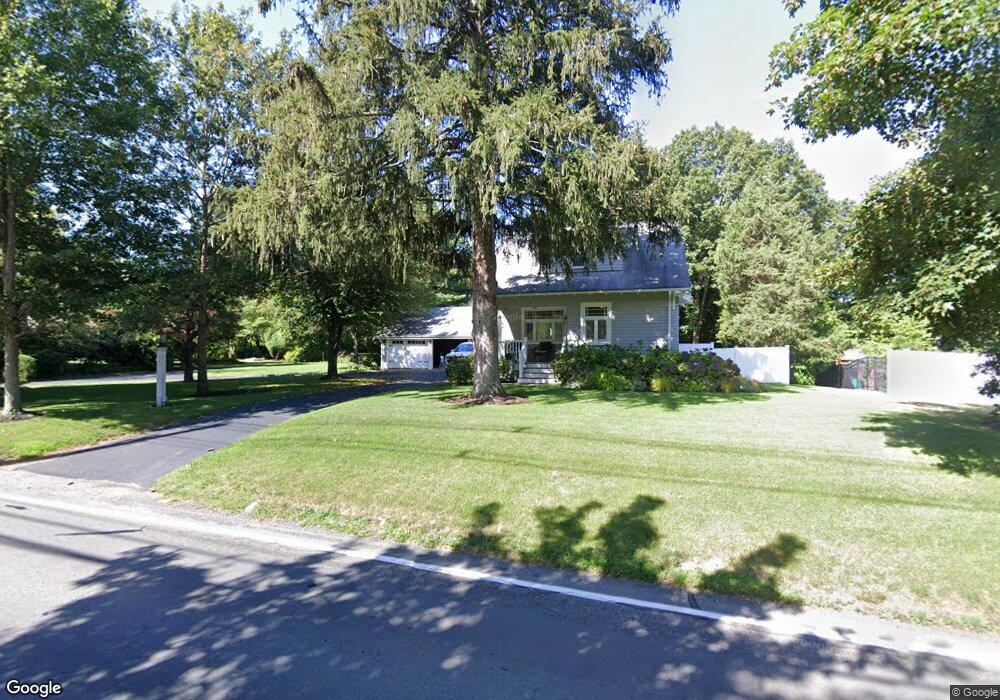
245 Cushing St Hingham, MA 02043
South Hingham NeighborhoodEstimated Value: $813,000 - $1,182,000
3
Beds
2
Baths
1,756
Sq Ft
$601/Sq Ft
Est. Value
About This Home
This home is located at 245 Cushing St, Hingham, MA 02043 and is currently estimated at $1,055,251, approximately $600 per square foot. 245 Cushing St is a home located in Plymouth County with nearby schools including South Elementary School, Hingham Middle School, and Hingham High School.
Ownership History
Date
Name
Owned For
Owner Type
Purchase Details
Closed on
Nov 5, 2024
Sold by
Guihan J L J and Guihan Susan E
Bought by
J Lawrnce Guihan Ret and Guihan
Current Estimated Value
Purchase Details
Closed on
Jan 25, 1985
Bought by
Guihan J Lawrence and Guihan Susan E
Create a Home Valuation Report for This Property
The Home Valuation Report is an in-depth analysis detailing your home's value as well as a comparison with similar homes in the area
Home Values in the Area
Average Home Value in this Area
Purchase History
| Date | Buyer | Sale Price | Title Company |
|---|---|---|---|
| J Lawrnce Guihan Ret | -- | None Available | |
| J Lawrnce Guihan Ret | -- | None Available | |
| Guihan J Lawrence | $127,000 | -- |
Source: Public Records
Mortgage History
| Date | Status | Borrower | Loan Amount |
|---|---|---|---|
| Previous Owner | Guihan J Lawrence | $190,000 | |
| Previous Owner | Guihan J Lawrence | $180,000 |
Source: Public Records
Tax History
| Year | Tax Paid | Tax Assessment Tax Assessment Total Assessment is a certain percentage of the fair market value that is determined by local assessors to be the total taxable value of land and additions on the property. | Land | Improvement |
|---|---|---|---|---|
| 2025 | $10,076 | $942,600 | $485,000 | $457,600 |
| 2024 | $9,787 | $902,000 | $485,000 | $417,000 |
| 2023 | $8,636 | $863,600 | $485,000 | $378,600 |
| 2022 | $8,241 | $712,900 | $407,700 | $305,200 |
| 2021 | $8,088 | $685,400 | $407,700 | $277,700 |
| 2020 | $7,903 | $685,400 | $407,700 | $277,700 |
| 2019 | $7,878 | $667,100 | $407,700 | $259,400 |
| 2018 | $7,801 | $662,800 | $407,700 | $255,100 |
| 2017 | $7,378 | $602,300 | $388,100 | $214,200 |
| 2016 | $7,298 | $584,300 | $370,100 | $214,200 |
| 2015 | $7,105 | $567,000 | $352,800 | $214,200 |
Source: Public Records
Map
Nearby Homes
- 5 Old County Rd
- 2 Black Rock Dr Unit 21
- 2 Black Rock Dr
- 13 Independence Ln
- 4 Kerri Ln
- 1 Kerri Ln
- 11 Berkley Cir
- 183 Gardner St
- 18 Whiting Ln
- 1 Hemlock Rd
- 1276 Washington St Unit A
- 1272 Washington St Unit G
- 22 Longmeadow Rd
- 14 Old Stone Way Unit 11
- 49 Raymond St
- 12 Country Dr
- 1297 Pleasant St
- 100 Whiting St
- 14 Cross St
- 126 Lakehurst Ave
- 6 Cape Cod Ln
- 4 Cape Cod Ln
- 231 Cushing St
- 239 Cushing St
- 243 Cushing St
- 3 Cape Cod Ln
- 221 Cushing St
- 25 Plymouth River Rd
- 23 Plymouth River Rd
- 27 Plymouth River Rd
- 249 Cushing St
- 29 Plymouth River Rd
- 21 Plymouth River Rd
- 1 Appletree Ln
- 213 Cushing St
- 213 Cushing St
- 253 Cushing St
- 2 Appletree Ln
- 19 Plymouth River Rd
- 215 Cushing St
Your Personal Tour Guide
Ask me questions while you tour the home.