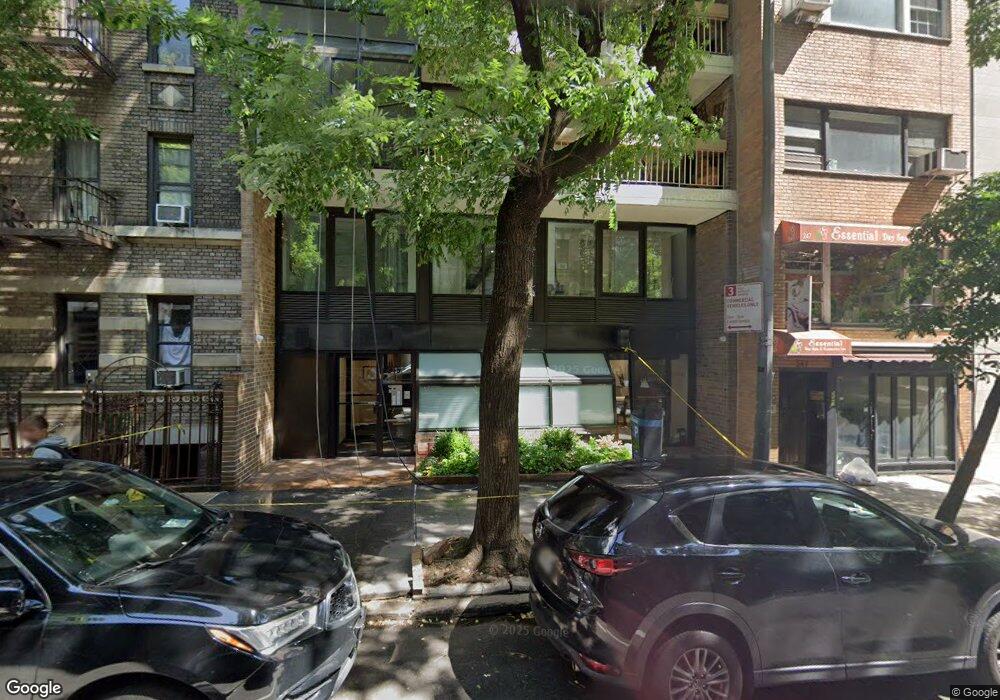
245 E 50th St Unit 7A New York, NY 10022
Turtle Bay NeighborhoodEstimated Value: $833,000 - $1,075,720
1
Bed
1
Bath
790
Sq Ft
$1,248/Sq Ft
Est. Value
About This Home
This home is located at 245 E 50th St Unit 7A, New York, NY 10022 and is currently estimated at $985,680, approximately $1,247 per square foot. 245 E 50th St Unit 7A is a home located in New York County with nearby schools including P.S. 59 Beekman Hill International, Simon Baruch Middle School 104, and Clinton School.
Ownership History
Date
Name
Owned For
Owner Type
Purchase Details
Closed on
Jun 1, 2020
Sold by
Bhalla Ashok
Bought by
Durham Matthew and Ullmann Katherine
Current Estimated Value
Home Financials for this Owner
Home Financials are based on the most recent Mortgage that was taken out on this home.
Original Mortgage
$681,500
Outstanding Balance
$605,224
Interest Rate
3.3%
Mortgage Type
Unknown
Estimated Equity
$380,456
Purchase Details
Closed on
Sep 5, 2003
Sold by
Ulrich Jr Frank
Bought by
Bhalla Ashok
Home Financials for this Owner
Home Financials are based on the most recent Mortgage that was taken out on this home.
Original Mortgage
$322,700
Interest Rate
6.01%
Mortgage Type
Purchase Money Mortgage
Purchase Details
Closed on
Aug 27, 1998
Sold by
Fiesole American Corp
Bought by
Ulrich Frank
Home Financials for this Owner
Home Financials are based on the most recent Mortgage that was taken out on this home.
Original Mortgage
$200,000
Interest Rate
6.92%
Create a Home Valuation Report for This Property
The Home Valuation Report is an in-depth analysis detailing your home's value as well as a comparison with similar homes in the area
Home Values in the Area
Average Home Value in this Area
Purchase History
| Date | Buyer | Sale Price | Title Company |
|---|---|---|---|
| Durham Matthew | $757,500 | -- | |
| Bhalla Ashok | $505,000 | -- | |
| Ulrich Frank | $250,000 | Ticor Title Guarantee |
Source: Public Records
Mortgage History
| Date | Status | Borrower | Loan Amount |
|---|---|---|---|
| Open | Durham Matthew | $681,500 | |
| Previous Owner | Bhalla Ashok | $322,700 | |
| Previous Owner | Ulrich Frank | $200,000 | |
| Closed | Bhalla Ashok | $31,000 |
Source: Public Records
Tax History Compared to Growth
Tax History
| Year | Tax Paid | Tax Assessment Tax Assessment Total Assessment is a certain percentage of the fair market value that is determined by local assessors to be the total taxable value of land and additions on the property. | Land | Improvement |
|---|---|---|---|---|
| 2025 | $18,067 | $148,437 | $31,799 | $116,638 |
| 2024 | $18,067 | $144,515 | $31,799 | $112,716 |
| 2023 | $14,393 | $142,215 | $31,799 | $110,416 |
| 2022 | $14,237 | $146,807 | $31,799 | $115,008 |
| 2021 | $16,794 | $137,876 | $31,799 | $106,077 |
| 2020 | $15,663 | $151,497 | $31,799 | $119,698 |
| 2019 | $16,172 | $137,956 | $31,799 | $106,157 |
| 2018 | $15,778 | $140,977 | $31,799 | $109,178 |
| 2017 | $14,942 | $135,439 | $31,799 | $103,640 |
| 2016 | $14,175 | $133,292 | $31,799 | $101,493 |
| 2015 | $8,121 | $112,702 | $31,799 | $80,903 |
| 2014 | $8,121 | $107,190 | $31,799 | $75,391 |
Source: Public Records
Map
Nearby Homes
- 255 E 49th St Unit 14D
- 255 E 49th St Unit 16F
- 255 E 49th St Unit 30ABC
- 255 E 49th St Unit 15A
- 255 E 49th St Unit 31C
- 250 E 49th St Unit 14CD
- 250 E 49th St Unit 3E
- 250 E 49th St Unit 5F
- 250 E 49th St Unit 10A
- 250 E 49th St Unit 23AB
- 235 E 49th St Unit 6-E
- 235 E 49th St Unit 6F
- 235 E 49th St Unit 4C
- 244 E 49th St
- 230 E 50th St Unit 9C
- 312-314 E 50th St Unit 1W
- 312-314 E 50th St Unit 4E
- 301 E 50th St Unit 4D
- 301 E 50th St Unit 8A
- 301 E 50th St Unit 17B
- 245 E 50th St
- 245 E 50th St Unit 9A
- 245 E 50th St Unit 8B
- 245 E 50th St Unit 8A
- 245 E 50th St Unit 7B
- 245 E 50th St Unit 6B
- 245 E 50th St Unit 6A
- 245 E 50th St Unit 5B
- 245 E 50th St Unit 5A
- 245 E 50th St Unit 4B
- 245 E 50th St Unit 4A
- 245 E 50th St Unit 3B
- 245 E 50th St Unit 3A
- 245 E 50th St Unit 2B
- 245 E 50th St Unit 2A
- 245 E 50th St Unit 9A/B/PH
- 247 E 50th St
- 235 E 50th St Unit 10
- 235 E 50th St
- 249 E 50th St Unit 7 A