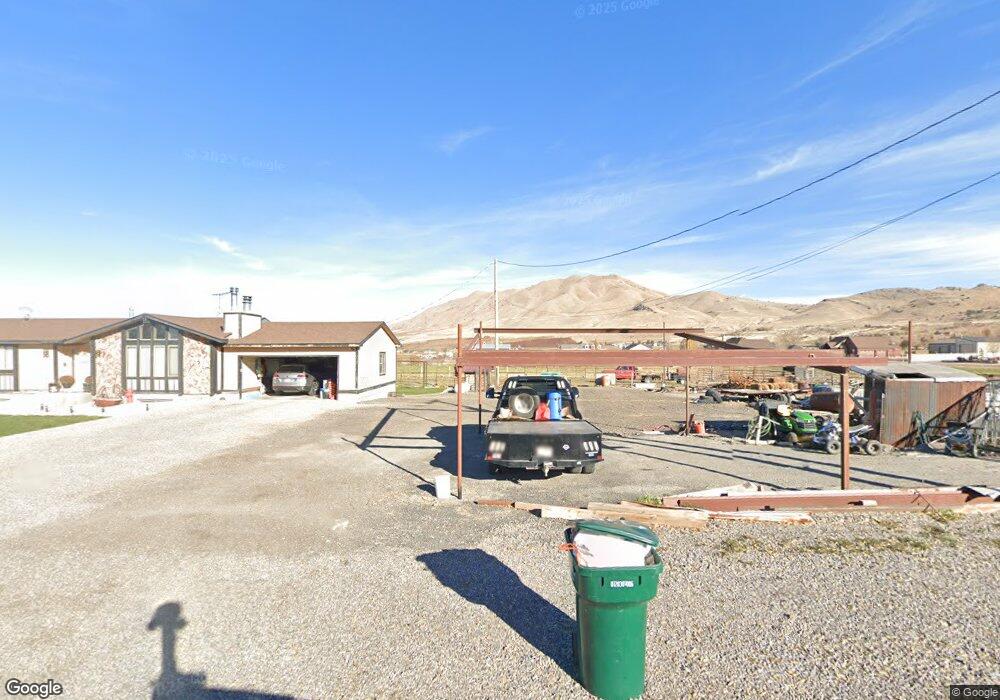
245 E 800 N Genola, UT 84655
Estimated Value: $631,000 - $786,000
3
Beds
3
Baths
1,498
Sq Ft
$491/Sq Ft
Est. Value
About This Home
This home is located at 245 E 800 N, Genola, UT 84655 and is currently estimated at $735,762, approximately $491 per square foot. 245 E 800 N is a home located in Utah County with nearby schools including Goshen Elementary school, Payson High School, and Payson Junior High School.
Ownership History
Date
Name
Owned For
Owner Type
Purchase Details
Closed on
Aug 19, 2015
Sold by
Gardner Howard and Gardner Patricia
Bought by
Carter Corey R
Current Estimated Value
Home Financials for this Owner
Home Financials are based on the most recent Mortgage that was taken out on this home.
Original Mortgage
$250,381
Outstanding Balance
$197,524
Interest Rate
4.12%
Mortgage Type
FHA
Estimated Equity
$538,238
Purchase Details
Closed on
Jun 28, 2011
Sold by
Nelson Kenneth H and Nelson Stephanie A
Bought by
Gardner Howard and Gardner Patricia
Purchase Details
Closed on
Jan 7, 2004
Sold by
Wallin Ralph and Wallin Diane
Bought by
Nelson Kenneth H and Nelson Stephanie A
Home Financials for this Owner
Home Financials are based on the most recent Mortgage that was taken out on this home.
Original Mortgage
$161,981
Interest Rate
5.88%
Mortgage Type
FHA
Create a Home Valuation Report for This Property
The Home Valuation Report is an in-depth analysis detailing your home's value as well as a comparison with similar homes in the area
Purchase History
| Date | Buyer | Sale Price | Title Company |
|---|---|---|---|
| Carter Corey R | -- | Title West | |
| Gardner Howard | -- | First American Orem | |
| Nelson Kenneth H | -- | Pro Title & Escrow Inc |
Source: Public Records
Mortgage History
| Date | Status | Borrower | Loan Amount |
|---|---|---|---|
| Open | Carter Corey R | $250,381 | |
| Previous Owner | Nelson Kenneth H | $161,981 |
Source: Public Records
Tax History
| Year | Tax Paid | Tax Assessment Tax Assessment Total Assessment is a certain percentage of the fair market value that is determined by local assessors to be the total taxable value of land and additions on the property. | Land | Improvement |
|---|---|---|---|---|
| 2025 | $2,956 | $345,865 | -- | -- |
| 2024 | $2,956 | $305,705 | $0 | $0 |
| 2023 | $2,917 | $302,240 | $0 | $0 |
| 2022 | $2,895 | $506,000 | $276,600 | $229,400 |
| 2021 | $2,481 | $379,600 | $191,700 | $187,900 |
| 2020 | $2,341 | $349,100 | $166,700 | $182,400 |
| 2019 | $2,013 | $308,100 | $143,800 | $164,300 |
| 2018 | $1,859 | $271,700 | $128,800 | $142,900 |
| 2017 | $1,756 | $149,910 | $0 | $0 |
| 2016 | $1,468 | $126,040 | $0 | $0 |
| 2015 | $1,273 | $114,490 | $0 | $0 |
| 2014 | $1,253 | $106,845 | $0 | $0 |
Source: Public Records
Map
Nearby Homes
- 956 N Main St
- 1220 N Hillside Dr
- 975 E 715 S
- 11508 S 5825 W
- 5746 W 11300 S
- 5635 W 11300 S
- 893 N 260 W Unit 227
- 892 N 260 W Unit 202
- 332 Stone Dr
- 11433 S 5600 W
- 11363 S 5600 West St
- 214 W 930 N
- 210 W 930 N
- 206 W 930 N
- 716 W Empress St Unit 12
- 712 W Empress St Unit 14
- 712 W Empress St Unit 13
- 704 Empress St Unit 15
- 702 W Empress St Unit 16
- 698 Empress St Unit 17
Your Personal Tour Guide
Ask me questions while you tour the home.