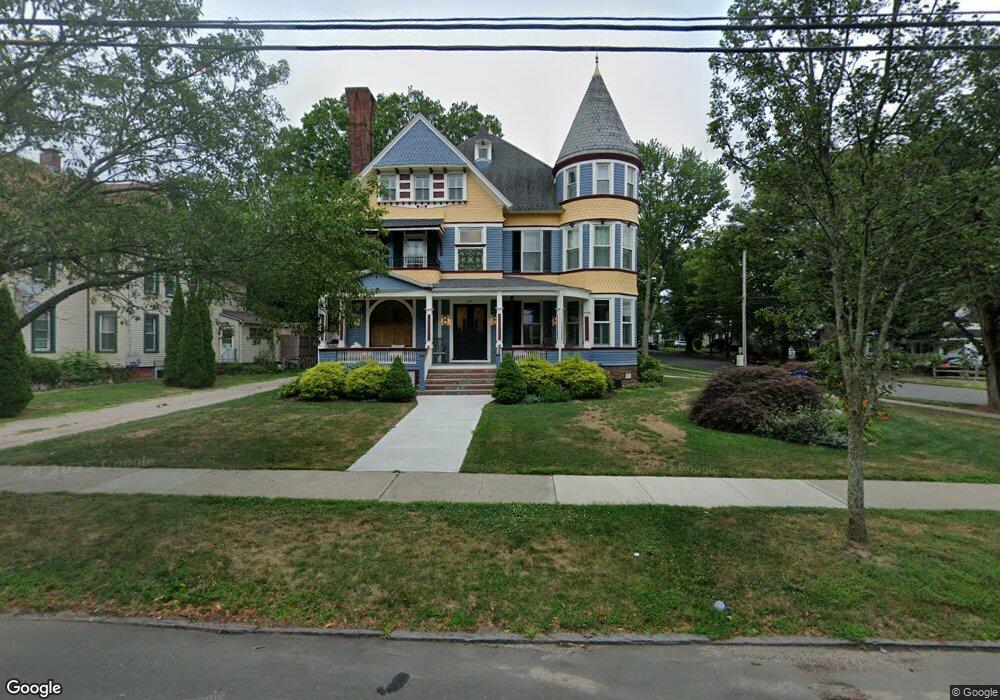
245 N Main St Wallingford, CT 06492
Estimated Value: $1,635,176
7
Beds
7
Baths
6,548
Sq Ft
$250/Sq Ft
Est. Value
About This Home
This home is located at 245 N Main St, Wallingford, CT 06492 and is currently estimated at $1,635,176, approximately $249 per square foot. 245 N Main St is a home located in New Haven County with nearby schools including Moses Y Beach Elementary School, Rock Hill Elementary School, and Dag Hammarskjold Middle School.
Ownership History
Date
Name
Owned For
Owner Type
Purchase Details
Closed on
Oct 26, 2021
Sold by
Wallingford Victorian Inn
Bought by
Fnd Choate Rosemary Hall
Current Estimated Value
Purchase Details
Closed on
Mar 23, 2017
Sold by
Kang Jeffrey and Kang Brenda
Bought by
Victorian Wallingford
Home Financials for this Owner
Home Financials are based on the most recent Mortgage that was taken out on this home.
Original Mortgage
$714,000
Interest Rate
4.17%
Mortgage Type
Commercial
Purchase Details
Closed on
Oct 29, 2009
Sold by
Barrett David M and Barrett Reta R
Bought by
Kang Jeffrey and Kang Brenda
Purchase Details
Closed on
May 12, 1998
Sold by
Plakins Edith S
Bought by
Barrett David M and Barrett Reta R
Create a Home Valuation Report for This Property
The Home Valuation Report is an in-depth analysis detailing your home's value as well as a comparison with similar homes in the area
Home Values in the Area
Average Home Value in this Area
Purchase History
| Date | Buyer | Sale Price | Title Company |
|---|---|---|---|
| Fnd Choate Rosemary Hall | $1,200,000 | None Available | |
| Choate Rosemary Hall Fnd | $1,200,000 | None Available | |
| Victorian Wallingford | $675,000 | -- | |
| Wallingford Victorian | $675,000 | -- | |
| Kang Jeffrey | $640,000 | -- | |
| Kang Jeffrey | $640,000 | -- | |
| Barrett David M | $299,000 | -- | |
| Barrett David M | $299,000 | -- |
Source: Public Records
Mortgage History
| Date | Status | Borrower | Loan Amount |
|---|---|---|---|
| Previous Owner | Barrett David M | $714,000 | |
| Previous Owner | Barrett David M | $512,000 |
Source: Public Records
Tax History
| Year | Tax Paid | Tax Assessment Tax Assessment Total Assessment is a certain percentage of the fair market value that is determined by local assessors to be the total taxable value of land and additions on the property. | Land | Improvement |
|---|---|---|---|---|
| 2025 | $33,568 | $1,391,700 | $140,000 | $1,251,700 |
| 2024 | $23,372 | $762,300 | $76,000 | $686,300 |
| 2023 | $13,655 | $465,400 | $76,000 | $389,400 |
| 2022 | $13,515 | $465,400 | $76,000 | $389,400 |
| 2021 | $13,273 | $465,400 | $76,000 | $389,400 |
| 2020 | $13,424 | $459,900 | $68,400 | $391,500 |
| 2019 | $13,424 | $459,900 | $68,400 | $391,500 |
| 2018 | $13,172 | $459,900 | $68,400 | $391,500 |
| 2017 | $13,130 | $459,900 | $68,400 | $391,500 |
| 2016 | $12,827 | $459,900 | $68,400 | $391,500 |
| 2015 | $13,158 | $479,000 | $101,600 | $377,400 |
| 2014 | $11,463 | $426,300 | $101,600 | $324,700 |
Source: Public Records
Map
Nearby Homes
- 85 N Colony St
- 42 S Cherry St Unit 238
- 46 Walnut Ln
- 570 N Main St
- 120 S Cherry St
- 71 Cedar Ln
- 1 Dean Dr
- 90 Masonic Ave
- 30 Clinton Place
- 5 Kish Place
- 31 S Turnpike Rd Unit C2
- 70 N Turnpike Rd Unit 21
- 69 Terrace Gardens
- 57 Terrace Gardens Unit 57
- 61 Cheshire Rd
- 30 King St
- 230 Main St Unit 18
- 54 Parker Farms Rd
- 101 Grieb Rd
- 89 Saw Mill Dr
- 255 N Main St
- 265 N Main St
- 24 Curtis Ave
- 13 Curtis Ave
- 9 Beaumont Ave
- 221 N Main St
- 221 N Main St Unit 2nd flr
- 273 N Main St
- 15 Curtis Ave
- 32 Curtis Ave
- 19 Curtis Ave
- 19 Curtis Ave Unit 1st floor
- 217 N Main St
- 217 N Main St Unit 3rd fl
- 256 N Main St Unit 2
- 264 N Main St
- 264 N Main St Unit 2
- 25 Curtis Ave
- 23 Beaumont Ave
- 36 Curtis Ave
Your Personal Tour Guide
Ask me questions while you tour the home.