Estimated Value: $197,644 - $210,000
2
Beds
1
Bath
1,152
Sq Ft
$176/Sq Ft
Est. Value
About This Home
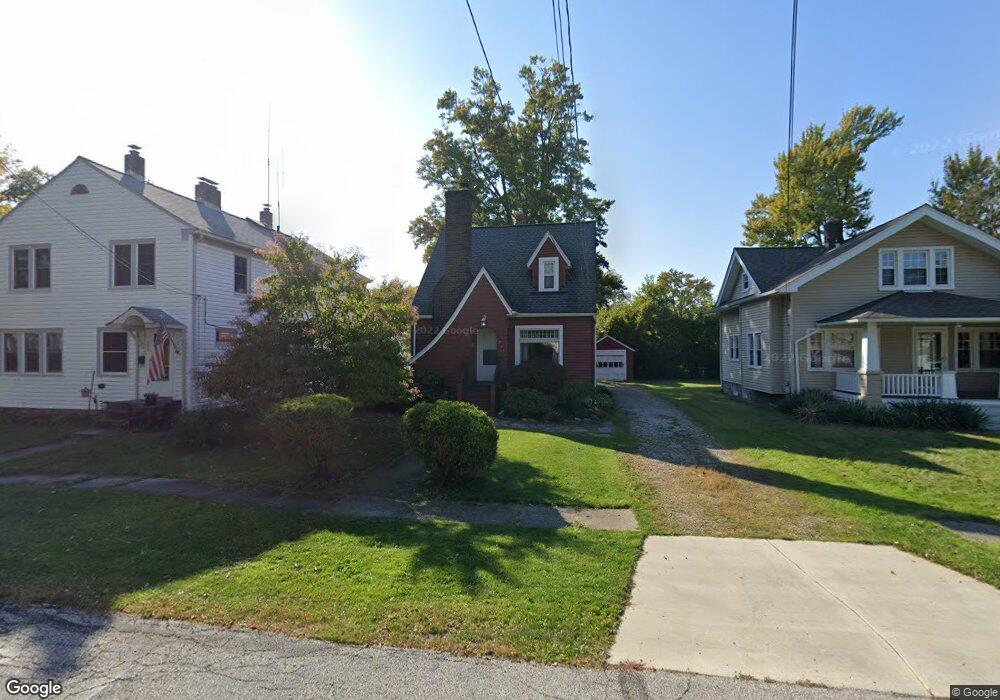
This home is located at 245 Runn St, Berea, OH 44017 and is currently estimated at $202,911, approximately $176 per square foot. 245 Runn St is a home located in Cuyahoga County with nearby schools including Grindstone Elementary School, Berea-Midpark Middle School, and Berea-Midpark High School.
Ownership History
Date
Name
Owned For
Owner Type
Purchase Details
Closed on
Dec 12, 2005
Sold by
Chandler Holtz Dennis P and Chandler Holtz Dawn M
Bought by
Riberdy Jason H and Riberdy Corrie Anne
Current Estimated Value
Home Financials for this Owner
Home Financials are based on the most recent Mortgage that was taken out on this home.
Original Mortgage
$104,975
Outstanding Balance
$58,978
Interest Rate
6.36%
Mortgage Type
Fannie Mae Freddie Mac
Estimated Equity
$143,933
Purchase Details
Closed on
Dec 2, 1993
Sold by
Johenning William A
Bought by
Chandler-Holtz Dennis P
Purchase Details
Closed on
Nov 30, 1989
Sold by
Schroll William R
Bought by
Johenning William A
Purchase Details
Closed on
May 17, 1978
Sold by
Hawkins Gregory W
Bought by
Schroll William R
Purchase Details
Closed on
Feb 5, 1976
Sold by
Mcgoron Charles and Mcgoron Nancy
Bought by
Hawkins Gregory W
Purchase Details
Closed on
Jan 1, 1975
Bought by
Mcgoron Charles and Mcgoron Nancy
Create a Home Valuation Report for This Property
The Home Valuation Report is an in-depth analysis detailing your home's value as well as a comparison with similar homes in the area
Home Values in the Area
Average Home Value in this Area
Purchase History
| Date | Buyer | Sale Price | Title Company |
|---|---|---|---|
| Riberdy Jason H | $110,500 | Title Access Llc | |
| Chandler-Holtz Dennis P | $85,500 | -- | |
| Johenning William A | $65,600 | -- | |
| Schroll William R | $43,000 | -- | |
| Hawkins Gregory W | $33,500 | -- | |
| Mcgoron Charles | -- | -- |
Source: Public Records
Mortgage History
| Date | Status | Borrower | Loan Amount |
|---|---|---|---|
| Open | Riberdy Jason H | $104,975 |
Source: Public Records
Tax History Compared to Growth
Tax History
| Year | Tax Paid | Tax Assessment Tax Assessment Total Assessment is a certain percentage of the fair market value that is determined by local assessors to be the total taxable value of land and additions on the property. | Land | Improvement |
|---|---|---|---|---|
| 2024 | $3,360 | $58,065 | $10,500 | $47,565 |
| 2023 | $3,073 | $44,490 | $10,750 | $33,740 |
| 2022 | $3,053 | $44,490 | $10,750 | $33,740 |
| 2021 | $3,027 | $44,490 | $10,750 | $33,740 |
| 2020 | $2,892 | $37,700 | $9,100 | $28,600 |
| 2019 | $2,815 | $107,700 | $26,000 | $81,700 |
| 2018 | $2,799 | $37,700 | $9,100 | $28,600 |
| 2017 | $2,713 | $33,920 | $6,230 | $27,690 |
| 2016 | $2,663 | $33,530 | $6,230 | $27,300 |
| 2015 | $2,622 | $33,530 | $6,230 | $27,300 |
| 2014 | $2,622 | $34,940 | $6,480 | $28,460 |
Source: Public Records
Map
Nearby Homes