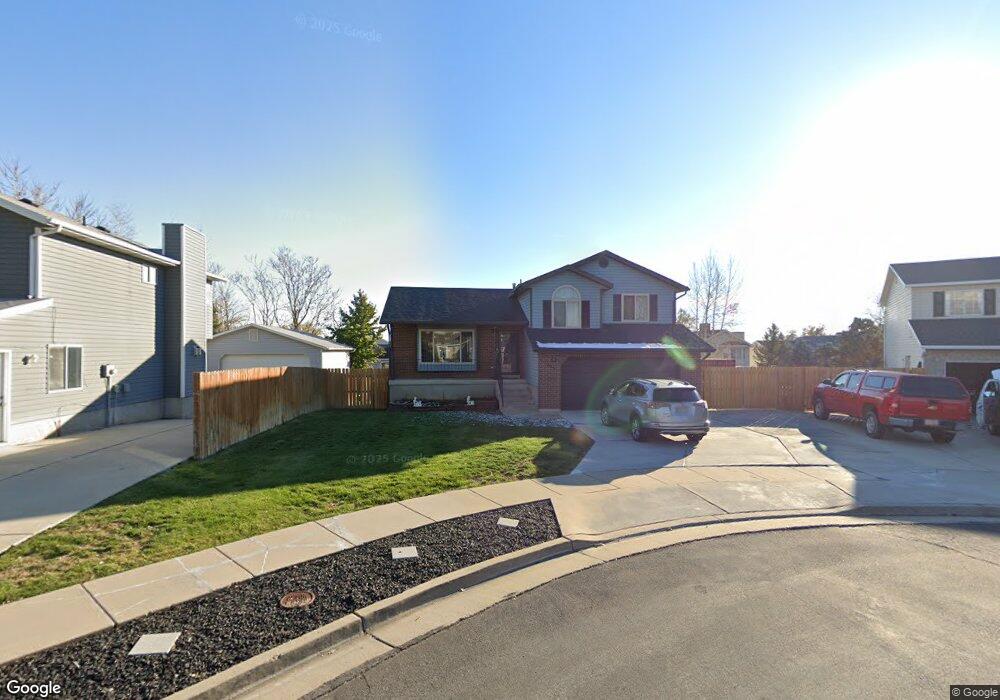
245 W 1275 N Layton, UT 84041
Estimated Value: $457,936 - $517,000
3
Beds
3
Baths
1,597
Sq Ft
$306/Sq Ft
Est. Value
About This Home
This home is located at 245 W 1275 N, Layton, UT 84041 and is currently estimated at $488,234, approximately $305 per square foot. 245 W 1275 N is a home located in Davis County with nearby schools including Crestview Elementary School, Central Davis Junior High School, and Northridge High School.
Ownership History
Date
Name
Owned For
Owner Type
Purchase Details
Closed on
May 18, 2020
Sold by
Brandt William
Bought by
Brandt William and Brandt Inruk
Current Estimated Value
Purchase Details
Closed on
May 3, 2001
Sold by
Brandt William D and Brandt Pamela M
Bought by
Brandt William
Home Financials for this Owner
Home Financials are based on the most recent Mortgage that was taken out on this home.
Original Mortgage
$119,900
Interest Rate
6.92%
Create a Home Valuation Report for This Property
The Home Valuation Report is an in-depth analysis detailing your home's value as well as a comparison with similar homes in the area
Home Values in the Area
Average Home Value in this Area
Purchase History
| Date | Buyer | Sale Price | Title Company |
|---|---|---|---|
| Brandt William | -- | None Available | |
| Brandt William | -- | Title One Inc |
Source: Public Records
Mortgage History
| Date | Status | Borrower | Loan Amount |
|---|---|---|---|
| Closed | Brandt William | $119,900 |
Source: Public Records
Tax History
| Year | Tax Paid | Tax Assessment Tax Assessment Total Assessment is a certain percentage of the fair market value that is determined by local assessors to be the total taxable value of land and additions on the property. | Land | Improvement |
|---|---|---|---|---|
| 2025 | $2,295 | $240,900 | $99,425 | $141,475 |
| 2024 | $2,190 | $231,550 | $116,296 | $115,254 |
| 2023 | $2,189 | $408,000 | $142,463 | $265,537 |
| 2022 | $2,255 | $228,250 | $74,061 | $154,189 |
| 2021 | $2,021 | $305,000 | $100,628 | $204,372 |
| 2020 | $1,830 | $265,000 | $86,031 | $178,969 |
| 2019 | $1,805 | $256,000 | $82,968 | $173,032 |
| 2018 | $1,622 | $231,000 | $82,968 | $148,032 |
| 2016 | $1,511 | $110,990 | $25,621 | $85,369 |
| 2015 | $1,436 | $100,155 | $25,621 | $74,534 |
| 2014 | $1,407 | $100,296 | $25,621 | $74,675 |
| 2013 | -- | $94,872 | $23,739 | $71,133 |
Source: Public Records
Map
Nearby Homes
Your Personal Tour Guide
Ask me questions while you tour the home.