Estimated Value: $97,000 - $194,000
4
Beds
2
Baths
2,198
Sq Ft
$73/Sq Ft
Est. Value
About This Home
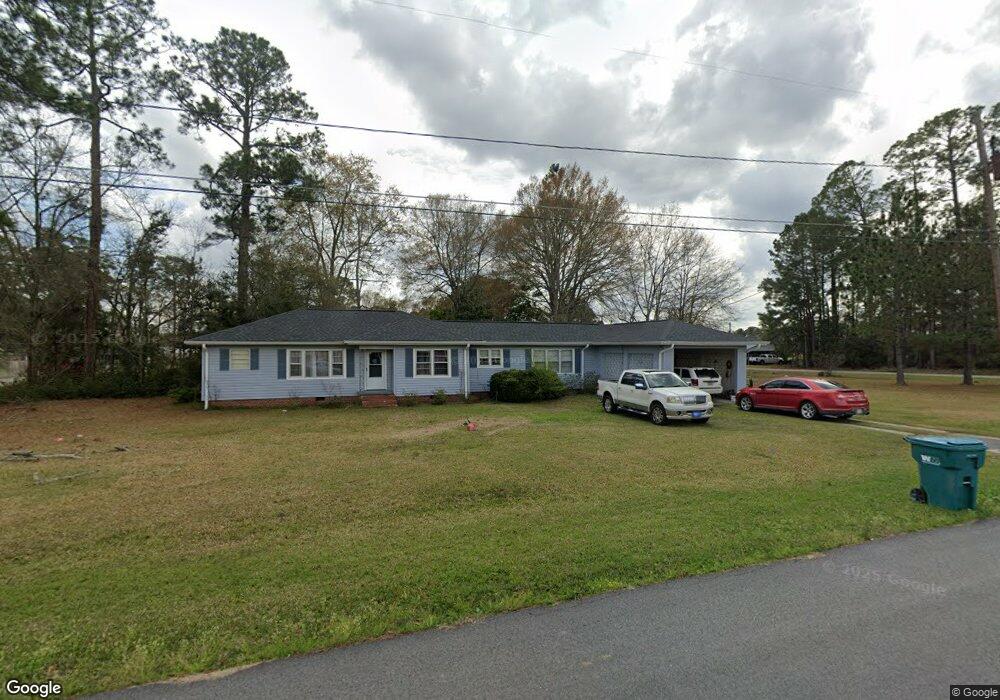
This home is located at 245 W Revels Ave, Lenox, GA 31637 and is currently estimated at $159,371, approximately $72 per square foot. 245 W Revels Ave is a home located in Cook County with nearby schools including Cook Primary School, Cook Elementary School, and Cook County Middle School.
Ownership History
Date
Name
Owned For
Owner Type
Purchase Details
Closed on
Jul 10, 2014
Sold by
Benjamin Margie
Bought by
Benjamin Margie and Benjamin Carl T
Current Estimated Value
Purchase Details
Closed on
Nov 5, 2013
Sold by
Davis John P
Bought by
Hsbc Bank Usa Na Trustee
Purchase Details
Closed on
Nov 23, 2005
Sold by
Prudential Residential Man
Bought by
Davis John Phillip
Home Financials for this Owner
Home Financials are based on the most recent Mortgage that was taken out on this home.
Original Mortgage
$65,250
Interest Rate
7.88%
Mortgage Type
New Conventional
Purchase Details
Closed on
Oct 26, 2005
Sold by
Watson Earl Travis
Bought by
Prudential Residential Svcs Li
Home Financials for this Owner
Home Financials are based on the most recent Mortgage that was taken out on this home.
Original Mortgage
$65,250
Interest Rate
7.88%
Mortgage Type
New Conventional
Create a Home Valuation Report for This Property
The Home Valuation Report is an in-depth analysis detailing your home's value as well as a comparison with similar homes in the area
Home Values in the Area
Average Home Value in this Area
Purchase History
| Date | Buyer | Sale Price | Title Company |
|---|---|---|---|
| Benjamin Margie | -- | -- | |
| Benjamin Margie | $35,829 | -- | |
| Hsbc Bank Usa Na Trustee | $50,000 | -- | |
| Davis John Phillip | $87,000 | -- | |
| Prudential Residential Svcs Li | $88,000 | -- |
Source: Public Records
Mortgage History
| Date | Status | Borrower | Loan Amount |
|---|---|---|---|
| Previous Owner | Davis John Phillip | $65,250 | |
| Previous Owner | Davis John Phillip | $21,750 |
Source: Public Records
Tax History Compared to Growth
Tax History
| Year | Tax Paid | Tax Assessment Tax Assessment Total Assessment is a certain percentage of the fair market value that is determined by local assessors to be the total taxable value of land and additions on the property. | Land | Improvement |
|---|---|---|---|---|
| 2024 | $1,195 | $44,360 | $5,152 | $39,208 |
| 2023 | $1,055 | $39,158 | $4,600 | $34,558 |
| 2022 | $1,055 | $39,158 | $4,600 | $34,558 |
| 2021 | $980 | $33,952 | $4,600 | $29,352 |
| 2020 | $980 | $33,952 | $4,600 | $29,352 |
| 2019 | $981 | $33,952 | $4,600 | $29,352 |
| 2018 | $982 | $33,952 | $4,600 | $29,352 |
| 2017 | $982 | $33,952 | $4,600 | $29,352 |
| 2016 | $983 | $33,952 | $4,600 | $29,352 |
| 2015 | $417 | $35,846 | $4,600 | $31,246 |
| 2014 | $986 | $35,846 | $4,600 | $31,246 |
| 2013 | -- | $35,846 | $4,600 | $31,246 |
Source: Public Records
Map
Nearby Homes
- 83 W Gray Ave
- 411 S Robinson St
- 77 S Bobby St
- 320 E Central Ave
- 801 Broad St
- 221 Rentz Bridge Rd
- 15150 U S 41
- 0 Barneyville Rd
- 86 Owen Medford Rd
- 0 E 0 Hwy 125 S
- 103 N College St
- 0 Murray McCranie Rd Unit 25079284
- 0 Murray McCranie Rd Unit 11586683
- 8422 Massee Post Rd
- 284 Barrett Rd
- 134 Brandy Ct
- 69 Branch Ln
- 105 Orchard Cir
- 3332 Ellenton Norman Park Rd
- 11010 Barneyville Rd
- 245 W Revels Ave
- 0 E Revels Ave
- TBD E Revels Ave
- 290 W Gray Ave
- 246 W Revels Ave
- 211 W Revels Ave
- 260 W Gray Ave
- 176 S Lindsey St
- 313 W Gray Ave
- 410 W Gray Ave
- 261 W Gray Ave
- 171 W Revels Ave
- 415 W Gray Ave
- 408 W Gray Ave
- 243 W Gray Ave
- 170 W Revels Ave
- 155 W Revels Ave
- 241 W Colquitt Ave
- 215 W Gray Ave
- 304 Hayes St