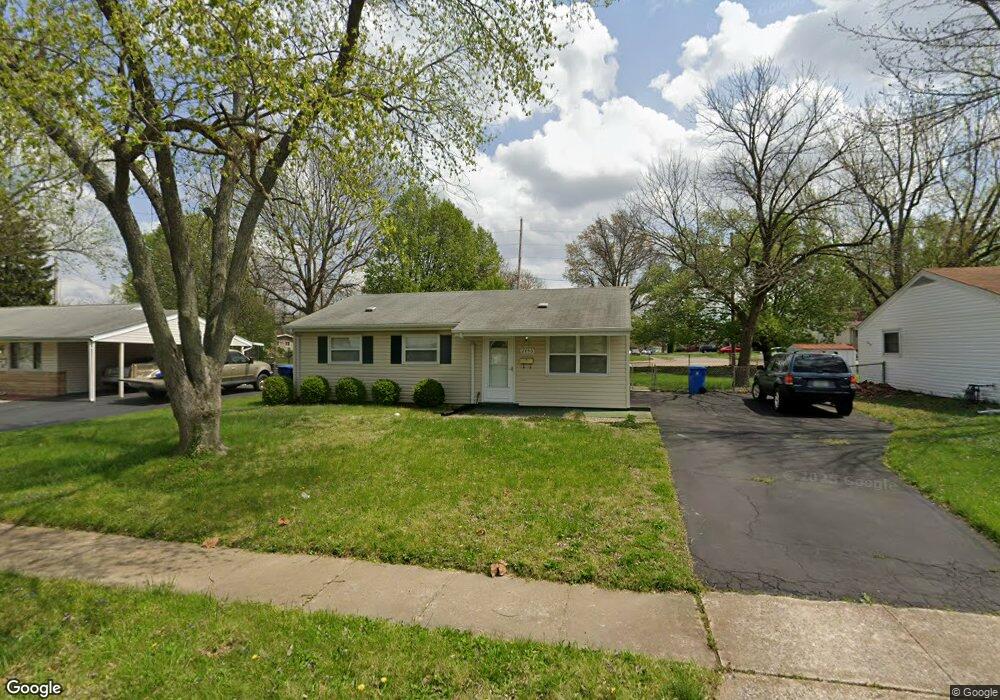
2450 6th Ln Florissant, MO 63031
Estimated Value: $128,000 - $141,000
3
Beds
2
Baths
936
Sq Ft
$144/Sq Ft
Est. Value
About This Home
This home is located at 2450 6th Ln, Florissant, MO 63031 and is currently estimated at $135,134, approximately $144 per square foot. 2450 6th Ln is a home located in St. Louis County with nearby schools including Cold Water Elementary School, North Middle School, and Hazelwood Central High School.
Ownership History
Date
Name
Owned For
Owner Type
Purchase Details
Closed on
Jul 10, 2009
Sold by
Greater Rising Star Mbc
Bought by
Hamilton Robert
Current Estimated Value
Purchase Details
Closed on
Feb 14, 2008
Sold by
Greater Rising Star Mbc
Bought by
Hamilton Robert
Purchase Details
Closed on
Jul 25, 2007
Sold by
Crowder Jeffrey R and Crowder Alvin Bernard
Bought by
Thompson Neal R and Thompson Lisa Marie
Purchase Details
Closed on
Nov 23, 2004
Sold by
Tourville Patricia
Bought by
Greater Rising Star Mbc
Purchase Details
Closed on
Aug 23, 2004
Sold by
Tourville Isaac and Tourville Patricia
Bought by
Peterson Robert H and County Of St Louis
Create a Home Valuation Report for This Property
The Home Valuation Report is an in-depth analysis detailing your home's value as well as a comparison with similar homes in the area
Home Values in the Area
Average Home Value in this Area
Purchase History
| Date | Buyer | Sale Price | Title Company |
|---|---|---|---|
| Hamilton Robert | -- | U S Title | |
| Hamilton Robert | -- | None Available | |
| Thompson Neal R | $50,000 | None Available | |
| Greater Rising Star Mbc | -- | -- | |
| Peterson Robert H | -- | -- |
Source: Public Records
Tax History Compared to Growth
Tax History
| Year | Tax Paid | Tax Assessment Tax Assessment Total Assessment is a certain percentage of the fair market value that is determined by local assessors to be the total taxable value of land and additions on the property. | Land | Improvement |
|---|---|---|---|---|
| 2025 | $1,747 | $25,080 | $5,550 | $19,530 |
| 2024 | $1,747 | $19,360 | $2,510 | $16,850 |
| 2023 | $1,745 | $19,360 | $2,510 | $16,850 |
| 2022 | $1,552 | $15,310 | $2,790 | $12,520 |
| 2021 | $1,512 | $15,310 | $2,790 | $12,520 |
| 2020 | $1,416 | $13,540 | $2,790 | $10,750 |
| 2019 | $1,395 | $13,540 | $2,790 | $10,750 |
| 2018 | $1,115 | $9,900 | $2,190 | $7,710 |
| 2017 | $1,113 | $9,900 | $2,190 | $7,710 |
| 2016 | $1,247 | $10,970 | $2,190 | $8,780 |
| 2015 | $1,221 | $10,970 | $2,190 | $8,780 |
| 2014 | $1,403 | $13,030 | $2,580 | $10,450 |
Source: Public Records
Map
Nearby Homes