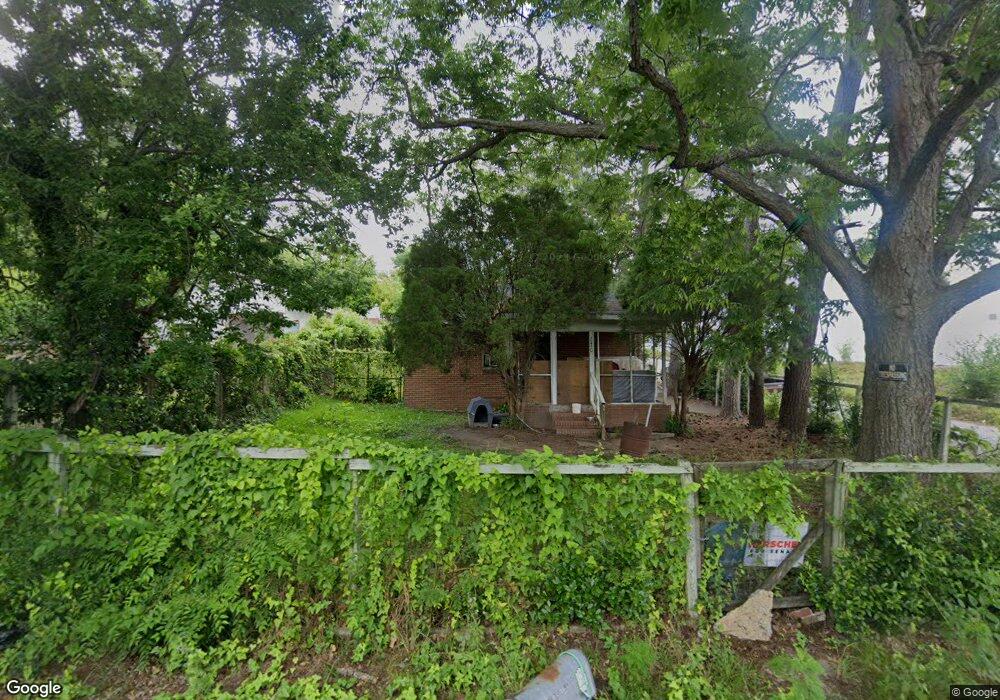
2450 Mason St Macon, GA 31206
Estimated Value: $58,845 - $73,000
2
Beds
1
Bath
1,066
Sq Ft
$63/Sq Ft
Est. Value
About This Home
This home is located at 2450 Mason St, Macon, GA 31206 and is currently estimated at $67,461, approximately $63 per square foot. 2450 Mason St is a home located in Bibb County with nearby schools including Hartley Elementary School, Southwest High School, and Cirrus Charter Academy.
Ownership History
Date
Name
Owned For
Owner Type
Purchase Details
Closed on
Jan 24, 2022
Sold by
Rodney Hlcks Mr
Bought by
Hicks Mrs Nancy Grantl
Current Estimated Value
Purchase Details
Closed on
Jan 23, 2022
Sold by
Rodney Hlcks Mr
Bought by
Hicks Mrs Nancy Grantl
Purchase Details
Closed on
Feb 25, 2013
Sold by
Hicks Earlene
Bought by
Hicks Rodney Glenn
Purchase Details
Closed on
Jul 26, 1978
Sold by
Mable Carswell By Extrx
Bought by
Hicks Earlene
Create a Home Valuation Report for This Property
The Home Valuation Report is an in-depth analysis detailing your home's value as well as a comparison with similar homes in the area
Purchase History
| Date | Buyer | Sale Price | Title Company |
|---|---|---|---|
| Hicks Mrs Nancy Grantl | -- | None Listed On Document | |
| Hicks Mrs Nancy Grantl | -- | None Listed On Document | |
| Hicks Rodney Glenn | -- | None Available | |
| Hicks Earlene | -- | -- |
Source: Public Records
Tax History
| Year | Tax Paid | Tax Assessment Tax Assessment Total Assessment is a certain percentage of the fair market value that is determined by local assessors to be the total taxable value of land and additions on the property. | Land | Improvement |
|---|---|---|---|---|
| 2025 | $247 | $17,062 | $1,716 | $15,346 |
| 2024 | $255 | $17,026 | $1,716 | $15,310 |
| 2023 | $233 | $14,873 | $1,560 | $13,313 |
| 2022 | $387 | $11,191 | $2,154 | $9,037 |
| 2021 | $222 | $5,841 | $1,795 | $4,046 |
| 2020 | $227 | $5,841 | $1,795 | $4,046 |
| 2019 | $229 | $5,841 | $1,795 | $4,046 |
| 2018 | $350 | $5,841 | $1,795 | $4,046 |
| 2017 | $219 | $5,841 | $1,795 | $4,046 |
| 2016 | $202 | $5,841 | $1,795 | $4,046 |
| 2015 | $286 | $5,841 | $1,795 | $4,046 |
| 2014 | $329 | $5,841 | $1,795 | $4,046 |
Source: Public Records
Map
Nearby Homes
- 2445 Adams Ave
- 2420 Adams Ave
- 1144 Carroll St
- 1121 Carroll St
- 1323 Crawford St
- 2164 Monroe Ave
- 1062 Rose St
- 2106 Mason St
- 1066 Jessamine St
- 2320 Ballard Dr
- 2125 Cedar Ave
- 1545 Anthony Rd
- 955 Ell St
- 210 Moseley Ave
- 1255 Ell St
- 670 Poppy Ave
- 2149 & 2147 Mercer University Dr
- 660 Lilly Ave
- 3064 Margaret Dr
- 742 Grayson Ave
- 2442 Mason St
- 2434 Mason St
- 2461 Adams Ave
- 2489 Adams Ave
- 2428 Mason St
- 2437 Adams Ave
- 2420 Mason St
- 2429 Adams Ave
- 2416 Mason St
- 2442 Adams Ave
- 2446 Adams Ave
- 2423 Adams Ave
- 2412 Mason St Unit A
- 2438 Adams Ave
- 2410 Mason St Unit A
- 2419 Adams Ave
- 2430 Adams Ave
- 2415 Adams Ave
- 1254 Ell St
- 2422 Adams Ave
Your Personal Tour Guide
Ask me questions while you tour the home.