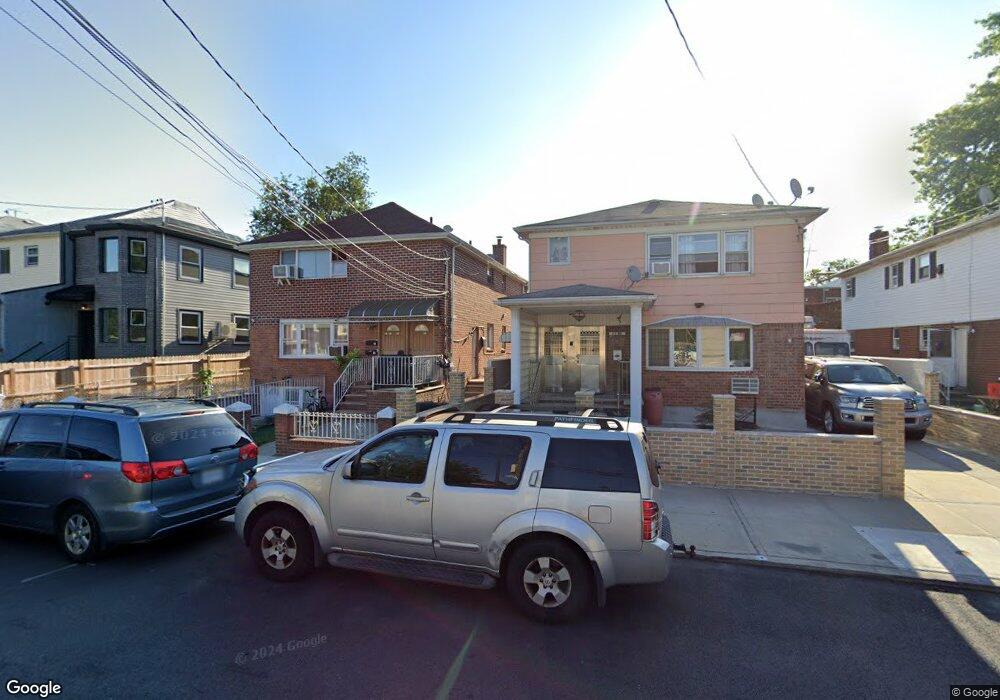
2451 95th St East Elmhurst, NY 11369
East Elmhurst NeighborhoodEstimated Value: $999,693 - $1,385,000
--
Bed
--
Bath
2,232
Sq Ft
$562/Sq Ft
Est. Value
About This Home
This home is located at 2451 95th St, East Elmhurst, NY 11369 and is currently estimated at $1,255,173, approximately $562 per square foot. 2451 95th St is a home located in Queens County with nearby schools including P.S. 127 Aerospace Science Magnet School, I.S. 145 Joseph Pulitzer Magnet School, and William Cullen Bryant High School.
Ownership History
Date
Name
Owned For
Owner Type
Purchase Details
Closed on
May 27, 2004
Sold by
Bartley Joseph and Bartley Ursula
Bought by
Begum Ferdoushi and Zaman Ashrafuz
Current Estimated Value
Home Financials for this Owner
Home Financials are based on the most recent Mortgage that was taken out on this home.
Original Mortgage
$378,000
Interest Rate
5.99%
Mortgage Type
Purchase Money Mortgage
Purchase Details
Closed on
Apr 27, 2002
Sold by
Nicholas Monica
Bought by
Bartley Joseph and Bartley Ursula
Purchase Details
Closed on
May 28, 1996
Sold by
Dorsey Alfreida C
Bought by
Bartley Joseph and Bartley Ursula
Home Financials for this Owner
Home Financials are based on the most recent Mortgage that was taken out on this home.
Original Mortgage
$158,700
Interest Rate
7.98%
Mortgage Type
FHA
Create a Home Valuation Report for This Property
The Home Valuation Report is an in-depth analysis detailing your home's value as well as a comparison with similar homes in the area
Home Values in the Area
Average Home Value in this Area
Purchase History
| Date | Buyer | Sale Price | Title Company |
|---|---|---|---|
| Begum Ferdoushi | $420,000 | -- | |
| Bartley Joseph | -- | -- | |
| Bartley Joseph | $165,000 | Ticor Title Guarantee Compan |
Source: Public Records
Mortgage History
| Date | Status | Borrower | Loan Amount |
|---|---|---|---|
| Previous Owner | Begum Ferdoushi | $378,000 | |
| Previous Owner | Bartley Joseph | $158,700 |
Source: Public Records
Tax History Compared to Growth
Tax History
| Year | Tax Paid | Tax Assessment Tax Assessment Total Assessment is a certain percentage of the fair market value that is determined by local assessors to be the total taxable value of land and additions on the property. | Land | Improvement |
|---|---|---|---|---|
| 2025 | $9,210 | $47,773 | $5,894 | $41,879 |
| 2024 | $9,210 | $45,853 | $5,934 | $39,919 |
| 2023 | $8,936 | $44,489 | $5,828 | $38,661 |
| 2022 | $8,379 | $69,120 | $9,660 | $59,460 |
| 2021 | $8,785 | $64,320 | $9,660 | $54,660 |
| 2020 | $8,427 | $59,460 | $9,660 | $49,800 |
| 2019 | $7,993 | $59,640 | $9,660 | $49,980 |
| 2018 | $7,558 | $37,074 | $5,927 | $31,147 |
| 2017 | $7,130 | $34,976 | $5,787 | $29,189 |
| 2016 | $6,954 | $34,976 | $5,787 | $29,189 |
| 2015 | $3,980 | $33,176 | $8,581 | $24,595 |
| 2014 | $3,980 | $31,843 | $9,886 | $21,957 |
Source: Public Records
Map
Nearby Homes