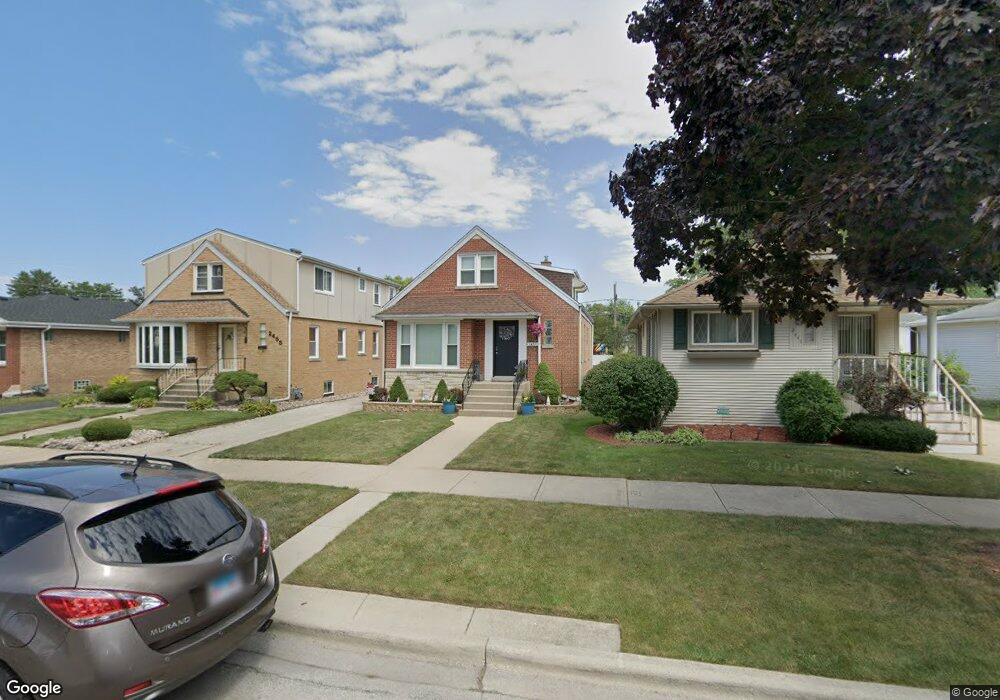
2451 Clinton St River Grove, IL 60171
Estimated Value: $320,000 - $370,683
3
Beds
2
Baths
938
Sq Ft
$373/Sq Ft
Est. Value
About This Home
This home is located at 2451 Clinton St, River Grove, IL 60171 and is currently estimated at $349,921, approximately $373 per square foot. 2451 Clinton St is a home located in Cook County with nearby schools including River Grove School, St. Celestine School, and St. Francis Borgia School.
Ownership History
Date
Name
Owned For
Owner Type
Purchase Details
Closed on
May 19, 2011
Sold by
Fannie Mae
Bought by
Gibbs Mickey E
Current Estimated Value
Home Financials for this Owner
Home Financials are based on the most recent Mortgage that was taken out on this home.
Original Mortgage
$143,760
Outstanding Balance
$98,934
Interest Rate
4.67%
Mortgage Type
FHA
Estimated Equity
$250,987
Purchase Details
Closed on
Feb 1, 2011
Sold by
Paluch
Bought by
Federal National Mortgage Association
Purchase Details
Closed on
Jun 30, 2008
Sold by
Paluch Henry and Lis Paluch Maria
Bought by
Chicago Title Land Trust Co and Trust #8002351023
Purchase Details
Closed on
Oct 26, 2007
Sold by
Paluch Henryk
Bought by
Paluch Henryk and Lis Paluch Maria
Home Financials for this Owner
Home Financials are based on the most recent Mortgage that was taken out on this home.
Original Mortgage
$262,000
Interest Rate
6.33%
Mortgage Type
New Conventional
Create a Home Valuation Report for This Property
The Home Valuation Report is an in-depth analysis detailing your home's value as well as a comparison with similar homes in the area
Home Values in the Area
Average Home Value in this Area
Purchase History
| Date | Buyer | Sale Price | Title Company |
|---|---|---|---|
| Gibbs Mickey E | $147,500 | Attorneys Title Guaranty Fun | |
| Federal National Mortgage Association | -- | None Available | |
| Chicago Title Land Trust Co | -- | Chicago Title Land Trust Co | |
| Paluch Henryk | -- | Stewart Title Of Illinois |
Source: Public Records
Mortgage History
| Date | Status | Borrower | Loan Amount |
|---|---|---|---|
| Open | Gibbs Mickey E | $143,760 | |
| Previous Owner | Paluch Henryk | $262,000 |
Source: Public Records
Tax History Compared to Growth
Tax History
| Year | Tax Paid | Tax Assessment Tax Assessment Total Assessment is a certain percentage of the fair market value that is determined by local assessors to be the total taxable value of land and additions on the property. | Land | Improvement |
|---|---|---|---|---|
| 2024 | $8,306 | $29,000 | $5,586 | $23,414 |
| 2023 | $8,109 | $29,000 | $5,586 | $23,414 |
| 2022 | $8,109 | $29,000 | $5,586 | $23,414 |
| 2021 | $5,834 | $18,847 | $3,990 | $14,857 |
| 2020 | $5,624 | $18,847 | $3,990 | $14,857 |
| 2019 | $5,617 | $21,345 | $3,990 | $17,355 |
| 2018 | $5,654 | $19,737 | $3,458 | $16,279 |
| 2017 | $6,008 | $20,905 | $3,458 | $17,447 |
| 2016 | $6,368 | $23,477 | $3,458 | $20,019 |
| 2015 | $5,208 | $18,721 | $3,059 | $15,662 |
| 2014 | $5,176 | $18,721 | $3,059 | $15,662 |
| 2013 | $4,948 | $18,721 | $3,059 | $15,662 |
Source: Public Records
Map
Nearby Homes
- 2501 Budd St
- 2504 Budd St
- 2414 N Haymond St
- 2524 Budd St
- 2542 Budd St
- 2561 Marwood St
- 2617 Budd St
- 2521 N Thatcher Ave Unit 2i
- 2521 N Thatcher Ave Unit 3A
- 8211 W Grand Ave
- 8250 W Grand Ave
- 2523 N East Brook Rd
- 7916 W Altgeld St
- 2726 Budd St
- 7917 W Westwood Dr
- 2533 Wood St
- 2424 Wood St
- 7849 W Westwood Dr
- 2443 Maple St
- 2504 N 78th Ave