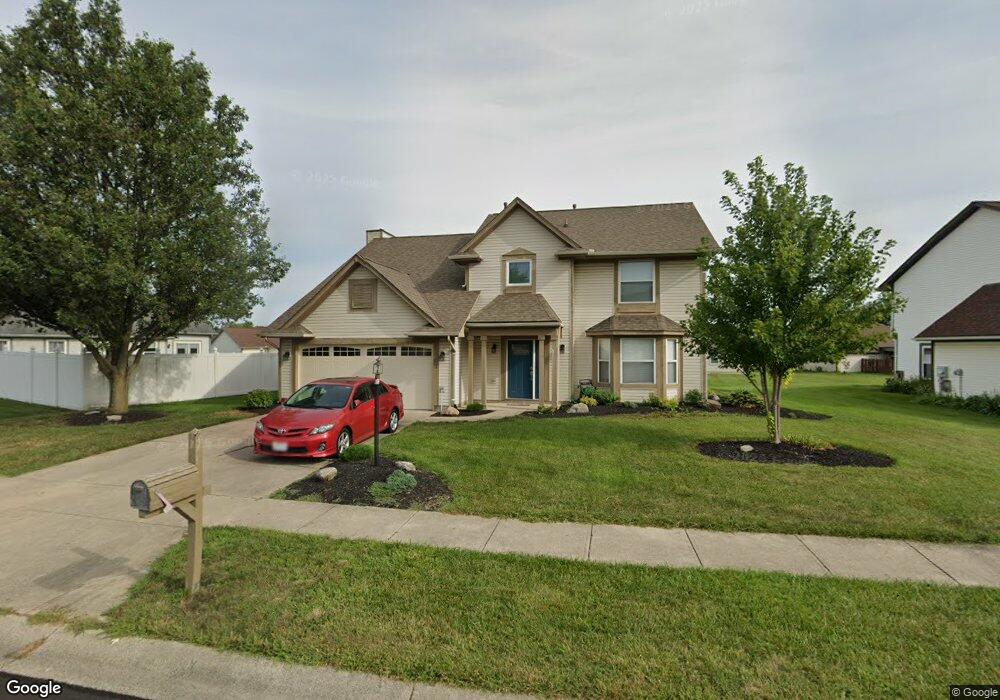
2451 Ferndown Dr Miamisburg, OH 45342
Estimated Value: $347,920 - $354,000
4
Beds
3
Baths
2,022
Sq Ft
$173/Sq Ft
Est. Value
About This Home
This home is located at 2451 Ferndown Dr, Miamisburg, OH 45342 and is currently estimated at $350,730, approximately $173 per square foot. 2451 Ferndown Dr is a home located in Montgomery County with nearby schools including Miamisburg High School, Bishop Leibold School, and Dayton Christian School.
Ownership History
Date
Name
Owned For
Owner Type
Purchase Details
Closed on
Oct 19, 2020
Sold by
Bussard Laura A and Bussard Scott A
Bought by
Smith Tenisha P
Current Estimated Value
Home Financials for this Owner
Home Financials are based on the most recent Mortgage that was taken out on this home.
Original Mortgage
$187,200
Interest Rate
2.71%
Mortgage Type
New Conventional
Purchase Details
Closed on
Mar 16, 2012
Sold by
Puthoff Nicholas A and Puthoff Betty L
Bought by
Bussard Laura A and Bussard Scott A
Home Financials for this Owner
Home Financials are based on the most recent Mortgage that was taken out on this home.
Original Mortgage
$179,684
Interest Rate
4.37%
Mortgage Type
FHA
Purchase Details
Closed on
Aug 11, 1998
Sold by
Hundley Matthew E and Hundley Janey A
Bought by
Bussard Scott A and Bussard Laura A
Home Financials for this Owner
Home Financials are based on the most recent Mortgage that was taken out on this home.
Original Mortgage
$124,745
Interest Rate
7.07%
Mortgage Type
FHA
Purchase Details
Closed on
Apr 28, 1997
Sold by
Oberer Development Company
Bought by
Hundley Matthew E and Hundley Janey A
Create a Home Valuation Report for This Property
The Home Valuation Report is an in-depth analysis detailing your home's value as well as a comparison with similar homes in the area
Home Values in the Area
Average Home Value in this Area
Purchase History
| Date | Buyer | Sale Price | Title Company |
|---|---|---|---|
| Smith Tenisha P | $234,000 | Vantage Land Title | |
| Bussard Laura A | -- | None Available | |
| Bussard Scott A | $140,000 | -- | |
| Bussard Scott A | $140,000 | -- | |
| Hundley Matthew E | $140,200 | -- |
Source: Public Records
Mortgage History
| Date | Status | Borrower | Loan Amount |
|---|---|---|---|
| Previous Owner | Smith Tenisha P | $187,200 | |
| Previous Owner | Bussard Laura A | $179,684 | |
| Previous Owner | Bussard Scott A | $124,745 |
Source: Public Records
Tax History Compared to Growth
Tax History
| Year | Tax Paid | Tax Assessment Tax Assessment Total Assessment is a certain percentage of the fair market value that is determined by local assessors to be the total taxable value of land and additions on the property. | Land | Improvement |
|---|---|---|---|---|
| 2024 | $6,882 | $98,780 | $17,010 | $81,770 |
| 2023 | $6,882 | $98,780 | $17,010 | $81,770 |
| 2022 | $6,072 | $73,170 | $12,600 | $60,570 |
| 2021 | $5,666 | $73,170 | $12,600 | $60,570 |
| 2020 | $5,609 | $73,170 | $12,600 | $60,570 |
| 2019 | $5,356 | $63,320 | $10,500 | $52,820 |
| 2018 | $5,318 | $63,320 | $10,500 | $52,820 |
| 2017 | $5,287 | $63,320 | $10,500 | $52,820 |
| 2016 | $4,685 | $53,740 | $10,500 | $43,240 |
| 2015 | $4,606 | $53,740 | $10,500 | $43,240 |
| 2014 | $4,606 | $53,740 | $10,500 | $43,240 |
| 2012 | -- | $55,510 | $13,300 | $42,210 |
Source: Public Records
Map
Nearby Homes
- 2378 Ferndown Dr
- 2115 Autumn Haze Trail
- 1963 Waterstone Blvd Unit 104
- 9406 Tahoe Dr Unit 19406
- 1875 Waterstone Blvd Unit 312
- 9604 Tahoe Dr
- 9528 Summer Wind Trail
- 9588 Tahoe Dr
- 1794 Placid Dr
- 9515 Tahoe Dr
- 9540 Tahoe Dr
- 9519 Tahoe Dr
- 1739 Waterstone Blvd Unit 208
- 9251 Great Lakes Cir Unit 59251
- 9553 Tahoe Dr
- 2968 Asbury Ct
- 1591 Watermark Ct Unit 241591
- 1573 Watermark Ct Unit 221573
- 9607 Olde Georgetown
- 9372 Parkside Dr
- 2443 Ferndown Dr
- 9122 Marquis Dr
- 9116 Marquis Dr
- 2437 Ferndown Dr
- 9110 Marquis Dr
- 2456 Ferndown Dr
- 2374 Pewter Hills Ct
- 2450 Ferndown Dr
- 2462 Ferndown Dr
- 2431 Ferndown Dr
- 2444 Ferndown Dr
- 2468 Ferndown Dr
- 2436 Ferndown Dr
- 2368 Pewter Hills Ct
- 2430 Ferndown Dr
- 9123 Marquis Dr
- 2425 Ferndown Dr
- 9117 Marquis Dr
- 2474 Ferndown Dr
- 9111 Marquis Dr