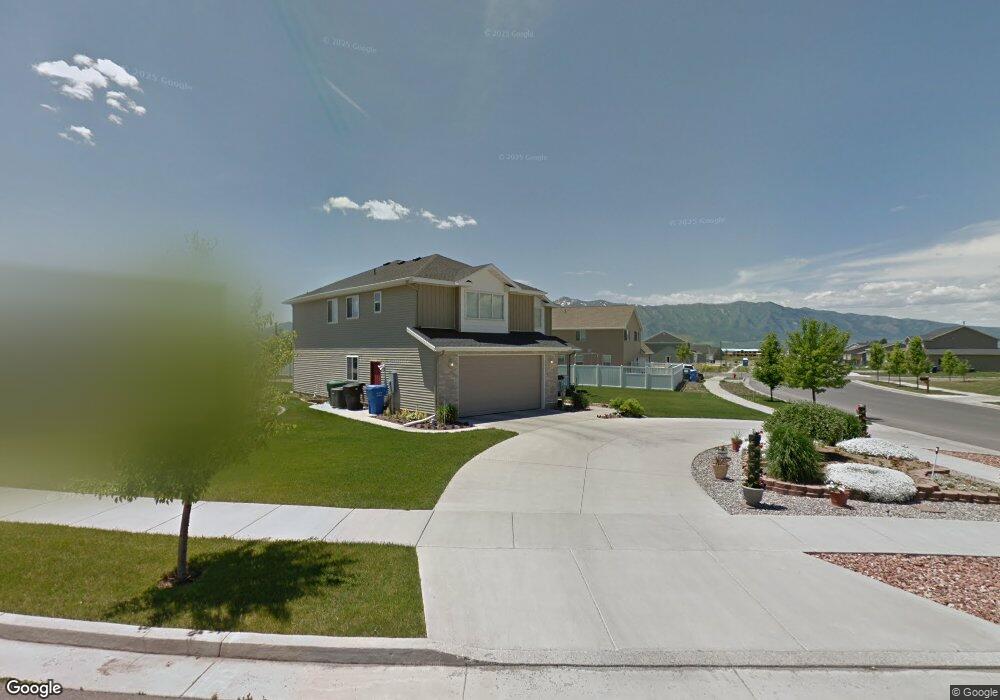
2451 S 960 W Nibley, UT 84321
Estimated Value: $544,000 - $602,000
4
Beds
3
Baths
2,551
Sq Ft
$222/Sq Ft
Est. Value
About This Home
This home is located at 2451 S 960 W, Nibley, UT 84321 and is currently estimated at $565,136, approximately $221 per square foot. 2451 S 960 W is a home located in Cache County with nearby schools including Nibley School, Spring Creek Middle School, and South Cache Middle School.
Ownership History
Date
Name
Owned For
Owner Type
Purchase Details
Closed on
Feb 12, 2021
Sold by
Schwen Karen
Bought by
Chlarson Walter Keith and Chlarson Kathryn
Current Estimated Value
Home Financials for this Owner
Home Financials are based on the most recent Mortgage that was taken out on this home.
Original Mortgage
$120,000
Outstanding Balance
$106,643
Interest Rate
2.6%
Mortgage Type
New Conventional
Estimated Equity
$458,493
Purchase Details
Closed on
Aug 3, 2016
Sold by
Anderson Kelly P and Anderson Ruth G
Bought by
The Presiding Bishop Of The Church Of Je
Purchase Details
Closed on
Aug 2, 2016
Sold by
The Presiding Bishop Of The Church Of Je
Bought by
Schwen Karen
Purchase Details
Closed on
May 31, 2006
Sold by
Nibley Park Estates Llc
Bought by
Anderson Kelly P and Anderson Ruth G
Home Financials for this Owner
Home Financials are based on the most recent Mortgage that was taken out on this home.
Original Mortgage
$31,433
Interest Rate
10%
Mortgage Type
Purchase Money Mortgage
Create a Home Valuation Report for This Property
The Home Valuation Report is an in-depth analysis detailing your home's value as well as a comparison with similar homes in the area
Home Values in the Area
Average Home Value in this Area
Purchase History
| Date | Buyer | Sale Price | Title Company |
|---|---|---|---|
| Chlarson Walter Keith | -- | None Listed On Document | |
| The Presiding Bishop Of The Church Of Je | -- | Hickman Land Title | |
| Schwen Karen | -- | Hickman Land Title | |
| Anderson Kelly P | -- | Cache Title Company |
Source: Public Records
Mortgage History
| Date | Status | Borrower | Loan Amount |
|---|---|---|---|
| Open | Chlarson Walter Keith | $120,000 | |
| Previous Owner | Anderson Kelly P | $31,433 |
Source: Public Records
Tax History Compared to Growth
Tax History
| Year | Tax Paid | Tax Assessment Tax Assessment Total Assessment is a certain percentage of the fair market value that is determined by local assessors to be the total taxable value of land and additions on the property. | Land | Improvement |
|---|---|---|---|---|
| 2025 | $2,315 | $306,835 | $0 | $0 |
| 2024 | $2,452 | $305,185 | $0 | $0 |
| 2023 | $2,566 | $299,090 | $0 | $0 |
| 2022 | $2,671 | $299,090 | $0 | $0 |
| 2021 | $2,105 | $366,044 | $65,000 | $301,044 |
| 2020 | $1,974 | $326,778 | $65,000 | $261,778 |
| 2019 | $2,071 | $326,777 | $65,000 | $261,777 |
| 2018 | $1,810 | $278,730 | $45,000 | $233,730 |
| 2017 | $1,805 | $147,180 | $0 | $0 |
| 2016 | $1,825 | $123,605 | $0 | $0 |
| 2015 | $1,523 | $123,605 | $0 | $0 |
| 2014 | $1,488 | $123,605 | $0 | $0 |
| 2013 | -- | $131,030 | $0 | $0 |
Source: Public Records
Map
Nearby Homes
- 1045 W 2400 S
- 2616 S 900 W
- 2271 S 1050 W
- 2271 S 1050 W Unit 96
- 1140 2260 S
- 2313 S 1000 W Unit 110
- 3308 S 1000 W
- 3318 S 1000 W
- 2237 S 1150 W Unit 39
- 2485 S 1296 W
- 1254 W 2401 S
- 2269 Clear Creek Rd
- 3074 S 800 W
- 2814 S 1150 W
- 2615 S 600 W
- 2882 S 1080 W
- 2680 S 600 W
- 907 W 2980 S
- 2174 S 1450 W
- 1469 W 2200 S