2452 11th St Unit 2 Cuyahoga Falls, OH 44221
Phelps Avenue NeighborhoodEstimated Value: $196,000 - $246,946
1
Bed
1
Bath
1,091
Sq Ft
$205/Sq Ft
Est. Value
About This Home
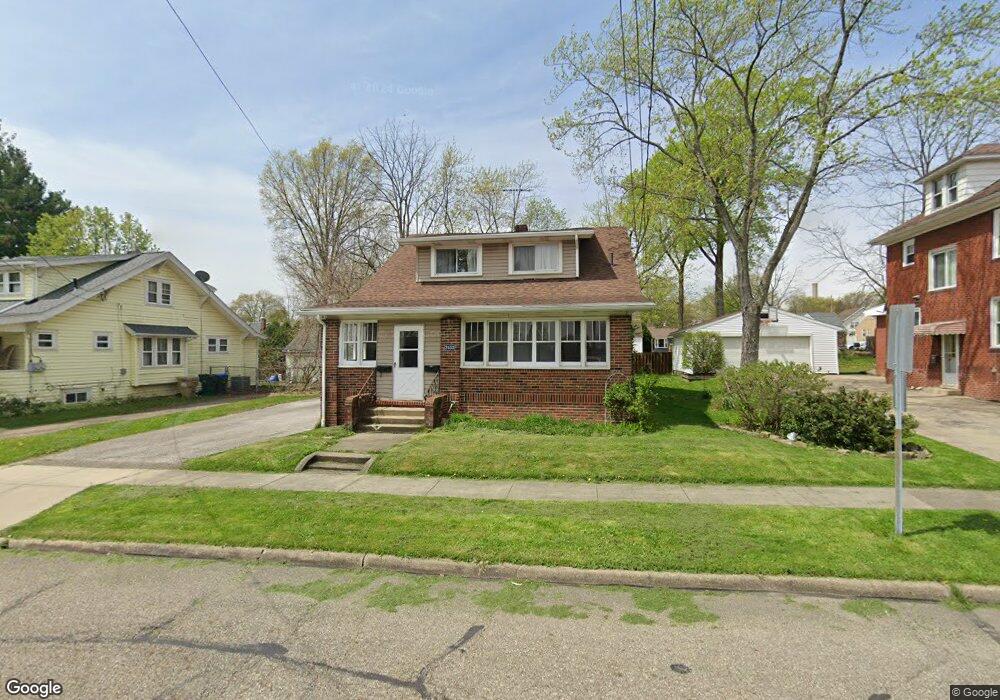
This home is located at 2452 11th St Unit 2, Cuyahoga Falls, OH 44221 and is currently estimated at $223,237, approximately $204 per square foot. 2452 11th St Unit 2 is a home located in Summit County with nearby schools including Dewitt Elementary School, Bolich Middle School, and Cuyahoga Falls High School.
Ownership History
Date
Name
Owned For
Owner Type
Purchase Details
Closed on
Aug 1, 2018
Sold by
Neil Christopehr N O and Neil Rita O O
Bought by
Bridgeate Holdings Llc
Current Estimated Value
Purchase Details
Closed on
Jun 7, 1995
Sold by
Caponi Mario
Bought by
O'Neil Christopher N and O'Neil Rita O
Create a Home Valuation Report for This Property
The Home Valuation Report is an in-depth analysis detailing your home's value as well as a comparison with similar homes in the area
Home Values in the Area
Average Home Value in this Area
Purchase History
| Date | Buyer | Sale Price | Title Company |
|---|---|---|---|
| Bridgeate Holdings Llc | -- | None Available | |
| O'Neil Christopher N | $50,000 | -- |
Source: Public Records
Mortgage History
| Date | Status | Borrower | Loan Amount |
|---|---|---|---|
| Closed | O'Neil Christopher N | -- |
Source: Public Records
Tax History Compared to Growth
Tax History
| Year | Tax Paid | Tax Assessment Tax Assessment Total Assessment is a certain percentage of the fair market value that is determined by local assessors to be the total taxable value of land and additions on the property. | Land | Improvement |
|---|---|---|---|---|
| 2025 | $4,050 | $73,343 | $12,040 | $61,303 |
| 2024 | $4,050 | $73,343 | $12,040 | $61,303 |
| 2023 | $4,050 | $73,343 | $12,040 | $61,303 |
| 2022 | $3,662 | $51,289 | $8,421 | $42,868 |
| 2021 | $3,484 | $51,289 | $8,421 | $42,868 |
| 2020 | $3,429 | $51,290 | $8,420 | $42,870 |
| 2019 | $2,708 | $36,900 | $8,320 | $28,580 |
| 2018 | $2,308 | $36,900 | $8,320 | $28,580 |
| 2017 | $2,283 | $36,900 | $8,320 | $28,580 |
| 2016 | $2,284 | $36,900 | $8,320 | $28,580 |
| 2015 | $2,283 | $36,900 | $8,320 | $28,580 |
| 2014 | $2,284 | $36,900 | $8,320 | $28,580 |
| 2013 | $2,611 | $42,550 | $8,320 | $34,230 |
Source: Public Records
Map
Nearby Homes