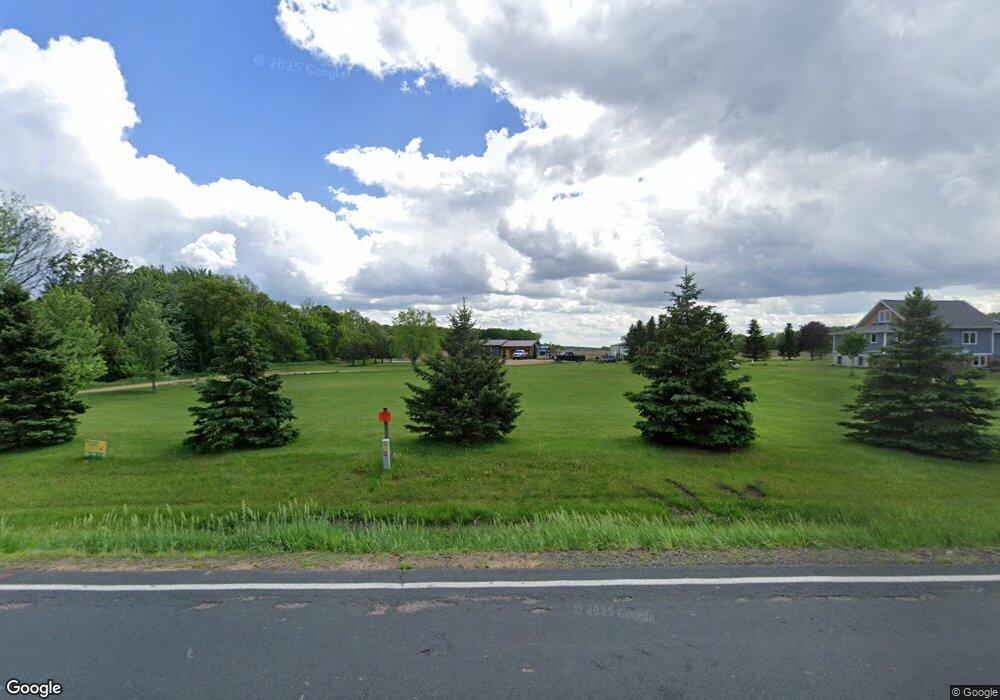
2452 40th Ave Osceola, WI 54020
Estimated Value: $324,000 - $362,000
3
Beds
2
Baths
--
Sq Ft
2.12
Acres
About This Home
This home is located at 2452 40th Ave, Osceola, WI 54020 and is currently estimated at $345,869. 2452 40th Ave is a home located in Polk County with nearby schools including Osceola Elementary School, Osceola Intermediate School, and Osceola Middle School.
Ownership History
Date
Name
Owned For
Owner Type
Purchase Details
Closed on
Jul 14, 2016
Sold by
Bonneprise John M
Bought by
Hause Leah N
Current Estimated Value
Home Financials for this Owner
Home Financials are based on the most recent Mortgage that was taken out on this home.
Original Mortgage
$137,750
Outstanding Balance
$110,249
Interest Rate
3.66%
Mortgage Type
New Conventional
Estimated Equity
$235,620
Purchase Details
Closed on
Jan 4, 2013
Sold by
Bonneprise John M and Bonneprise John
Bought by
Cottor Dennis R and Cottor Jane M
Create a Home Valuation Report for This Property
The Home Valuation Report is an in-depth analysis detailing your home's value as well as a comparison with similar homes in the area
Home Values in the Area
Average Home Value in this Area
Purchase History
| Date | Buyer | Sale Price | Title Company |
|---|---|---|---|
| Hause Leah N | $145,000 | Title One Premier Group Inc | |
| Cottor Dennis R | -- | -- |
Source: Public Records
Mortgage History
| Date | Status | Borrower | Loan Amount |
|---|---|---|---|
| Open | Hause Leah N | $137,750 |
Source: Public Records
Tax History Compared to Growth
Tax History
| Year | Tax Paid | Tax Assessment Tax Assessment Total Assessment is a certain percentage of the fair market value that is determined by local assessors to be the total taxable value of land and additions on the property. | Land | Improvement |
|---|---|---|---|---|
| 2024 | $3,087 | $252,500 | $39,000 | $213,500 |
| 2023 | $3,030 | $252,500 | $39,000 | $213,500 |
| 2022 | $2,763 | $151,000 | $20,400 | $130,600 |
| 2021 | $2,683 | $149,600 | $20,400 | $129,200 |
| 2020 | $2,717 | $149,600 | $20,400 | $129,200 |
| 2019 | $2,756 | $149,600 | $20,400 | $129,200 |
| 2018 | $2,913 | $149,600 | $20,400 | $129,200 |
| 2017 | $2,510 | $149,600 | $20,400 | $129,200 |
| 2016 | $2,075 | $103,100 | $20,200 | $82,900 |
| 2015 | $1,872 | $103,100 | $20,200 | $82,900 |
| 2013 | $1,759 | $103,100 | $20,200 | $82,900 |
| 2012 | $1,805 | $103,100 | $20,200 | $82,900 |
Source: Public Records
Map
Nearby Homes