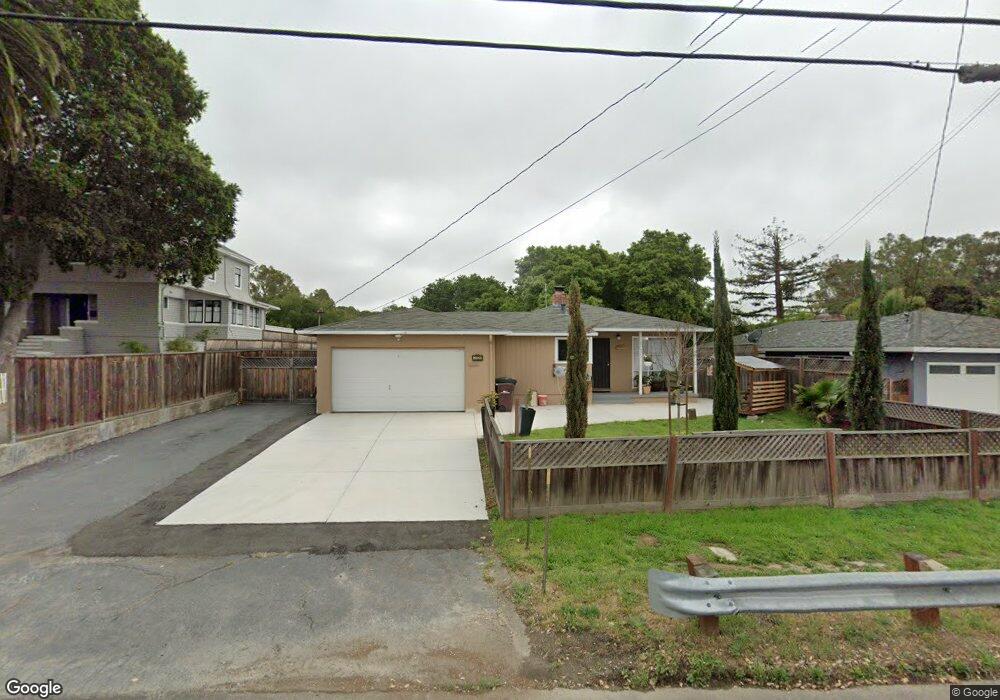
24529 2nd St Hayward, CA 94541
Mission-Foothill NeighborhoodEstimated Value: $857,000 - $963,000
3
Beds
2
Baths
2,099
Sq Ft
$434/Sq Ft
Est. Value
About This Home
This home is located at 24529 2nd St, Hayward, CA 94541 and is currently estimated at $911,808, approximately $434 per square foot. 24529 2nd St is a home located in Alameda County with nearby schools including East Avenue Elementary School, Bret Harte Middle School, and Hayward High School.
Ownership History
Date
Name
Owned For
Owner Type
Purchase Details
Closed on
May 18, 2015
Sold by
Jahanian Delbar
Bought by
Stender Nathan G
Current Estimated Value
Home Financials for this Owner
Home Financials are based on the most recent Mortgage that was taken out on this home.
Original Mortgage
$531,995
Outstanding Balance
$409,085
Interest Rate
3.63%
Mortgage Type
VA
Estimated Equity
$502,723
Create a Home Valuation Report for This Property
The Home Valuation Report is an in-depth analysis detailing your home's value as well as a comparison with similar homes in the area
Home Values in the Area
Average Home Value in this Area
Purchase History
| Date | Buyer | Sale Price | Title Company |
|---|---|---|---|
| Stender Nathan G | $532,000 | Old Republic Title Company | |
| Jahanian Delbar | -- | Old Republic Title Company |
Source: Public Records
Mortgage History
| Date | Status | Borrower | Loan Amount |
|---|---|---|---|
| Open | Stender Nathan G | $531,995 |
Source: Public Records
Tax History
| Year | Tax Paid | Tax Assessment Tax Assessment Total Assessment is a certain percentage of the fair market value that is determined by local assessors to be the total taxable value of land and additions on the property. | Land | Improvement |
|---|---|---|---|---|
| 2025 | $8,141 | $632,362 | $191,808 | $447,554 |
| 2024 | $8,141 | $619,828 | $188,048 | $438,780 |
| 2023 | $7,970 | $614,538 | $184,361 | $430,177 |
| 2022 | $7,795 | $595,490 | $180,747 | $421,743 |
| 2021 | $7,793 | $585,078 | $177,203 | $413,475 |
| 2020 | $7,689 | $584,624 | $175,387 | $409,237 |
| 2019 | $7,728 | $573,165 | $171,949 | $401,216 |
| 2018 | $7,248 | $561,930 | $168,579 | $393,351 |
| 2017 | $7,068 | $550,911 | $165,273 | $385,638 |
| 2016 | $6,666 | $540,112 | $162,033 | $378,079 |
| 2015 | $4,611 | $312,113 | $93,634 | $218,479 |
| 2014 | $3,842 | $306,000 | $91,800 | $214,200 |
Source: Public Records
Map
Nearby Homes
- 24185 Amaranth Loop
- 1696 East Ave
- 24805 Canyon View Ct
- 24849 2nd St
- 1665 Highland Blvd
- 1467 Clay St
- 944 Walpert St
- 22820 5th St
- 24889 Bland St
- 25265 Morse Ct
- 945 Fletcher Ln Unit A330
- 1743 Panda Way
- 0 Morse Ct Unit 41105392
- 22824 High St
- 25480 University Ct
- 22622 2nd St
- 22836 Watkins St
- 2468 Hidden Ln
- 1225 Richard Place
- 1315 A St Unit 206
Your Personal Tour Guide
Ask me questions while you tour the home.