Estimated Value: $44,946 - $71,000
1
Bed
1
Bath
882
Sq Ft
$61/Sq Ft
Est. Value
About This Home
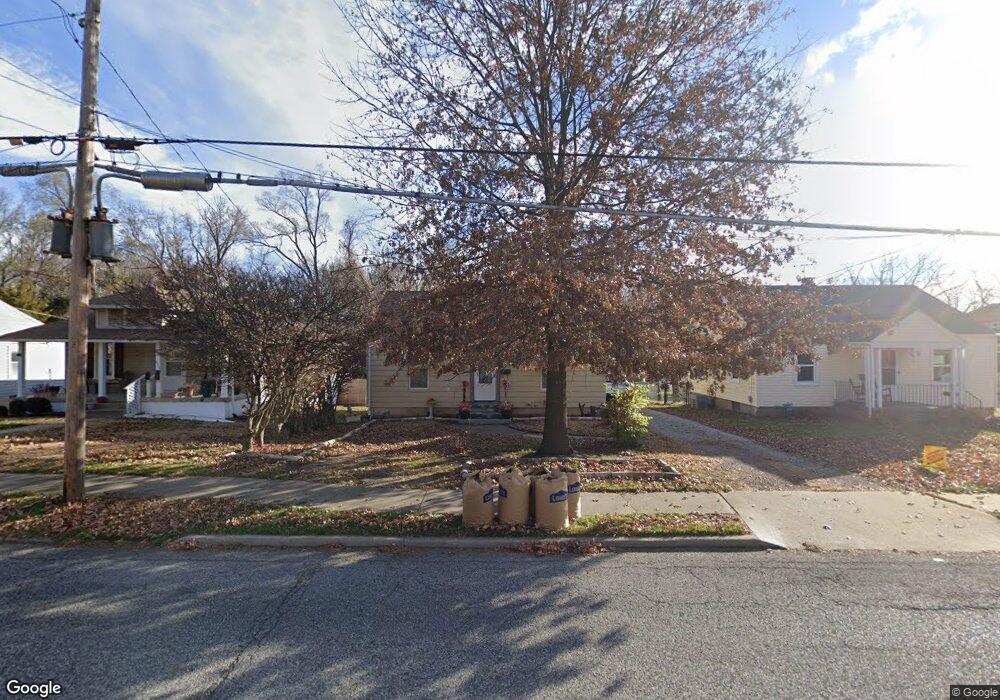
This home is located at 2453 Alby St, Alton, IL 62002 and is currently estimated at $53,987, approximately $61 per square foot. 2453 Alby St is a home located in Madison County with nearby schools including Eunice Smith Elementary School, Alton Middle School, and Alton High School.
Ownership History
Date
Name
Owned For
Owner Type
Purchase Details
Closed on
Jul 1, 2025
Sold by
Mathenia Randy G and Mathenia Gala D
Bought by
Odonahue Linda S
Current Estimated Value
Purchase Details
Closed on
Apr 13, 2006
Sold by
Wells Fargo Bank Minnesota Na
Bought by
Mathenia Randy G and Mathenia Gala D
Home Financials for this Owner
Home Financials are based on the most recent Mortgage that was taken out on this home.
Original Mortgage
$33,300
Interest Rate
6.48%
Mortgage Type
Fannie Mae Freddie Mac
Purchase Details
Closed on
Aug 22, 2005
Sold by
Logan Reba M and Logan Cox Reba M
Bought by
Wells Fargo Bank Minnesota Na
Create a Home Valuation Report for This Property
The Home Valuation Report is an in-depth analysis detailing your home's value as well as a comparison with similar homes in the area
Home Values in the Area
Average Home Value in this Area
Purchase History
| Date | Buyer | Sale Price | Title Company |
|---|---|---|---|
| Odonahue Linda S | $45,000 | Serenity Title & Escrow Ltd | |
| Mathenia Randy G | $37,000 | Fatic | |
| Wells Fargo Bank Minnesota Na | -- | -- |
Source: Public Records
Mortgage History
| Date | Status | Borrower | Loan Amount |
|---|---|---|---|
| Previous Owner | Mathenia Randy G | $33,300 |
Source: Public Records
Tax History Compared to Growth
Tax History
| Year | Tax Paid | Tax Assessment Tax Assessment Total Assessment is a certain percentage of the fair market value that is determined by local assessors to be the total taxable value of land and additions on the property. | Land | Improvement |
|---|---|---|---|---|
| 2024 | $1,495 | $18,390 | $1,950 | $16,440 |
| 2023 | $1,495 | $16,610 | $1,760 | $14,850 |
| 2022 | $1,405 | $15,010 | $1,590 | $13,420 |
| 2021 | $1,292 | $14,100 | $1,490 | $12,610 |
| 2020 | $1,262 | $13,600 | $1,440 | $12,160 |
| 2019 | $1,305 | $13,290 | $1,410 | $11,880 |
| 2018 | $1,270 | $12,940 | $1,370 | $11,570 |
| 2017 | $1,226 | $12,670 | $1,370 | $11,300 |
| 2016 | $1,201 | $12,670 | $1,370 | $11,300 |
| 2015 | $616 | $12,670 | $1,370 | $11,300 |
| 2014 | $616 | $12,670 | $1,370 | $11,300 |
| 2013 | $616 | $13,020 | $1,410 | $11,610 |
Source: Public Records
Map
Nearby Homes