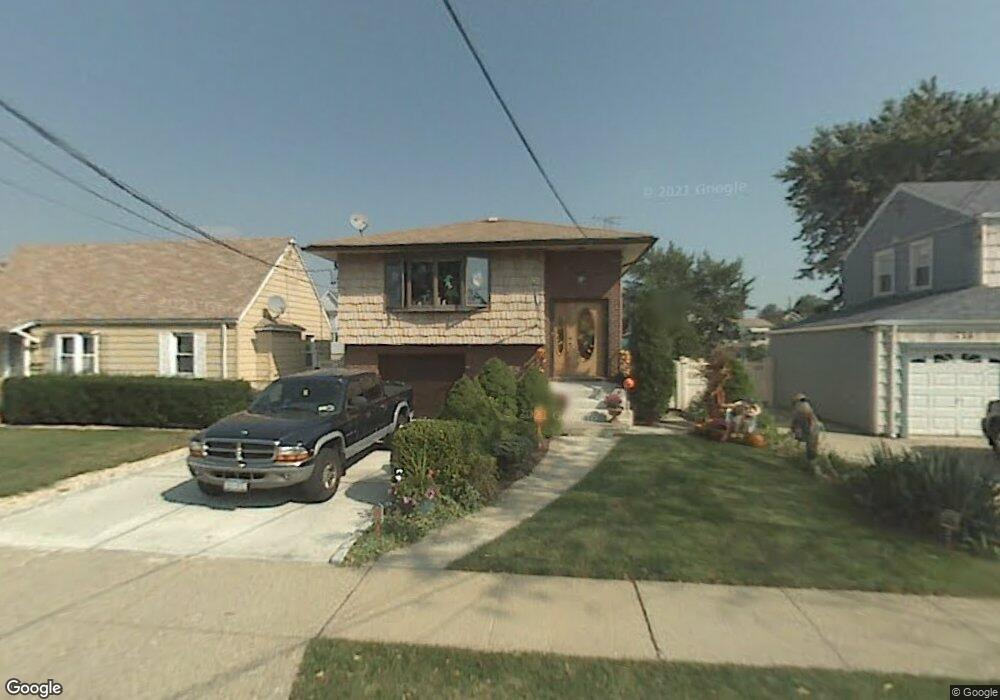
2453 Soma Ave Bellmore, NY 11710
Estimated Value: $790,608 - $825,000
3
Beds
2
Baths
2,042
Sq Ft
$396/Sq Ft
Est. Value
About This Home
This home is located at 2453 Soma Ave, Bellmore, NY 11710 and is currently estimated at $807,804, approximately $395 per square foot. 2453 Soma Ave is a home located in Nassau County with nearby schools including Lt. General Thomas P. Stafford Elementary School, Winthrop Avenue School, and Shore Road School.
Ownership History
Date
Name
Owned For
Owner Type
Purchase Details
Closed on
Nov 12, 2020
Sold by
Herman Dan
Bought by
Brenner Danielle
Current Estimated Value
Home Financials for this Owner
Home Financials are based on the most recent Mortgage that was taken out on this home.
Original Mortgage
$353,500
Outstanding Balance
$314,565
Interest Rate
2.8%
Mortgage Type
New Conventional
Estimated Equity
$493,239
Purchase Details
Closed on
Jan 15, 2010
Sold by
Tavalaro Julian and Tavalaro Michelle
Bought by
Herman Dan
Home Financials for this Owner
Home Financials are based on the most recent Mortgage that was taken out on this home.
Original Mortgage
$416,666
Interest Rate
3.75%
Mortgage Type
FHA
Purchase Details
Closed on
Oct 7, 2004
Sold by
Salluzzi Lorraine
Bought by
Tavalaro Julian
Purchase Details
Closed on
May 13, 1999
Create a Home Valuation Report for This Property
The Home Valuation Report is an in-depth analysis detailing your home's value as well as a comparison with similar homes in the area
Home Values in the Area
Average Home Value in this Area
Purchase History
| Date | Buyer | Sale Price | Title Company |
|---|---|---|---|
| Brenner Danielle | $505,000 | None Available | |
| Herman Dan | $455,000 | -- | |
| Tavalaro Julian | $455,000 | -- | |
| -- | $222,600 | -- |
Source: Public Records
Mortgage History
| Date | Status | Borrower | Loan Amount |
|---|---|---|---|
| Open | Brenner Danielle | $353,500 | |
| Previous Owner | Herman Dan | $416,666 |
Source: Public Records
Tax History Compared to Growth
Tax History
| Year | Tax Paid | Tax Assessment Tax Assessment Total Assessment is a certain percentage of the fair market value that is determined by local assessors to be the total taxable value of land and additions on the property. | Land | Improvement |
|---|---|---|---|---|
| 2025 | $15,429 | $508 | $163 | $345 |
| 2024 | $3,753 | $508 | $163 | $345 |
| 2023 | $14,700 | $530 | $170 | $360 |
| 2022 | $14,700 | $530 | $170 | $360 |
| 2021 | $19,902 | $555 | $178 | $377 |
| 2020 | $14,778 | $808 | $771 | $37 |
| 2019 | $4,113 | $866 | $699 | $167 |
| 2018 | $9,414 | $923 | $0 | $0 |
| 2017 | $9,789 | $1,024 | $826 | $198 |
| 2016 | $14,274 | $1,024 | $826 | $198 |
| 2015 | $4,176 | $1,024 | $826 | $198 |
| 2014 | $4,176 | $1,024 | $826 | $198 |
| 2013 | $3,921 | $1,024 | $826 | $198 |
Source: Public Records
Map
Nearby Homes
- 119 Ocean Ave
- 23 Bay St
- 2492 Lefferts Place
- 601 Hughes St
- 2542 Lefferts Place
- 163 Wynsum Ave
- 1360-1370 Merrick Rd
- 45 Henry St
- 14 Bell Ct
- 2770 Lincoln Blvd
- 217 Bayview Ave
- 2476 Florin Ct
- 201 Argyle Place
- 2355 Mitchell Place
- 43 Wynsum Ave
- 105 Howell St
- 732 Sunrise Ave
- 2573 Legion St
- 110 Hampton Way
- 2398 Centre Ave
- 711 Soma Ave
- 705 Soma Ave
- 2465 Soma Ave
- 712 Farmers Ave
- 714 Farmers Ave
- 2471 Soma Ave
- 708 Farmers Ave
- 2350 Merrick Rd
- 718 Farmers Ave
- 717 Soma Ave
- 2370 Merrick Rd
- 720 Farmers Ave
- 2481 Soma Ave
- 2318 Jeffrey Ct
- 2322 Jeffrey Ct
- 2482 Farmers Ave
- 709 Farmers Ave
- 2453 Farmers Ave
- 2467 Farmers Ave
- 721 Soma Ave