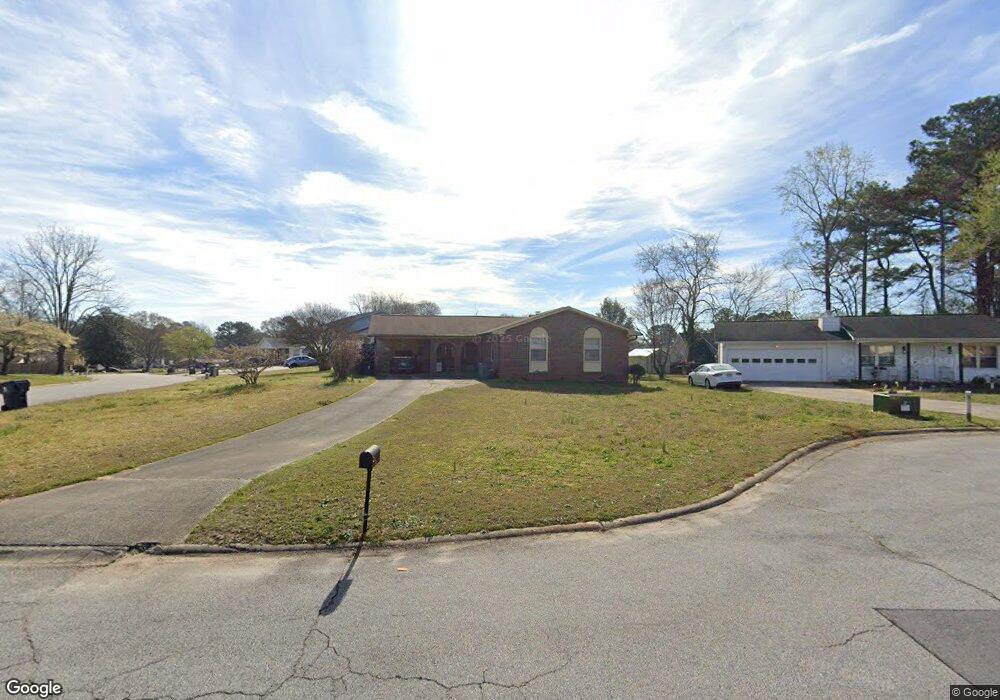
2453 Wakefield Cove Morrow, GA 30260
Estimated Value: $217,339 - $290,000
3
Beds
2
Baths
1,330
Sq Ft
$181/Sq Ft
Est. Value
About This Home
This home is located at 2453 Wakefield Cove, Morrow, GA 30260 and is currently estimated at $240,835, approximately $181 per square foot. 2453 Wakefield Cove is a home located in Clayton County with nearby schools including Thurgood Marshall Elementary School, Morrow Middle School, and Morrow High School.
Ownership History
Date
Name
Owned For
Owner Type
Purchase Details
Closed on
Aug 14, 2019
Sold by
Le Trung D
Bought by
Pham Cao Thanh
Current Estimated Value
Home Financials for this Owner
Home Financials are based on the most recent Mortgage that was taken out on this home.
Original Mortgage
$100,000
Outstanding Balance
$87,195
Interest Rate
3.8%
Mortgage Type
New Conventional
Estimated Equity
$153,640
Purchase Details
Closed on
Dec 14, 2015
Sold by
Ginn Zona Gale Vaughan
Bought by
Le Trung D
Home Financials for this Owner
Home Financials are based on the most recent Mortgage that was taken out on this home.
Original Mortgage
$48,700
Interest Rate
5.75%
Mortgage Type
New Conventional
Purchase Details
Closed on
Apr 14, 2014
Sold by
Ginn Dwight K
Bought by
Ginn Zona Gale Vaughan and Oswalt Lawanda Vaughan
Purchase Details
Closed on
Oct 21, 2004
Sold by
Vaughan Erin J
Bought by
Ginn Dwight K
Create a Home Valuation Report for This Property
The Home Valuation Report is an in-depth analysis detailing your home's value as well as a comparison with similar homes in the area
Home Values in the Area
Average Home Value in this Area
Purchase History
| Date | Buyer | Sale Price | Title Company |
|---|---|---|---|
| Pham Cao Thanh | $133,500 | -- | |
| Le Trung D | $75,000 | -- | |
| Ginn Zona Gale Vaughan | -- | -- | |
| Ginn Dwight K | -- | -- |
Source: Public Records
Mortgage History
| Date | Status | Borrower | Loan Amount |
|---|---|---|---|
| Open | Pham Cao Thanh | $100,000 | |
| Previous Owner | Le Trung D | $48,700 |
Source: Public Records
Tax History
| Year | Tax Paid | Tax Assessment Tax Assessment Total Assessment is a certain percentage of the fair market value that is determined by local assessors to be the total taxable value of land and additions on the property. | Land | Improvement |
|---|---|---|---|---|
| 2025 | $3,891 | $101,600 | $7,200 | $94,400 |
| 2024 | $3,477 | $89,120 | $7,200 | $81,920 |
| 2023 | $3,323 | $92,040 | $7,200 | $84,840 |
| 2022 | $2,589 | $65,960 | $7,200 | $58,760 |
| 2021 | $2,272 | $57,520 | $7,200 | $50,320 |
| 2020 | $2,136 | $53,400 | $7,200 | $46,200 |
| 2019 | $1,890 | $46,547 | $4,800 | $41,747 |
| 2018 | $1,708 | $42,076 | $4,800 | $37,276 |
| 2017 | $1,305 | $32,071 | $4,800 | $27,271 |
| 2016 | $1,077 | $26,456 | $4,800 | $21,656 |
| 2015 | $854 | $0 | $0 | $0 |
| 2014 | $60 | $17,022 | $6,400 | $10,622 |
Source: Public Records
Map
Nearby Homes
- 6200 Fieldcrest Dr Unit 3
- 6205 Fieldcrest Dr
- 6203 Castlewood Dr
- 2455 Lake Harbin Rd
- 2509 Bonita Ct
- 2497 Celina Ct
- 2542 Burton Cir
- 6364 Maddox Rd
- 6359 Lanier Rd
- 6418 Maddox Rd
- 6413 Maddox Rd
- 6227 Mount Zion Blvd
- 2391 Prestige Valley Ct
- 2567 Creston Way
- 2280 Santa fe St Unit 17
- 2306 Santa fe St Unit 9
- 6380 Mount Zion Blvd
- 0 Maddox Rd Unit 10674000
- 2717 Shelley Ln
- 6397 E Meyer Dr
- 2453 Wakefield Cove Unit 2
- 2449 Wakefield Cove
- 6209 Landover Cir Unit 1
- 6202 Landover Cir
- 6208 Landover Cir
- 2443 Wakefield Cove
- 6213 Landover Cir
- 2452 Wakefield Cove
- 2474 Harbin Village Ct
- 2470 Harbin Village Ct
- 2448 Wakefield Cove Unit 2
- 2442 Wakefield Cove
- 6194 Landover Cir
- 6212 Landover Cir Unit 2
- 6217 Landover Cir Unit 2
- 6195 Landover Cir Unit 2
- 2469 Harbin Village Ct
- 2480 Harbin Village Ct
- 6216 Fieldcrest Dr
- 6216 Landover Cir
Your Personal Tour Guide
Ask me questions while you tour the home.