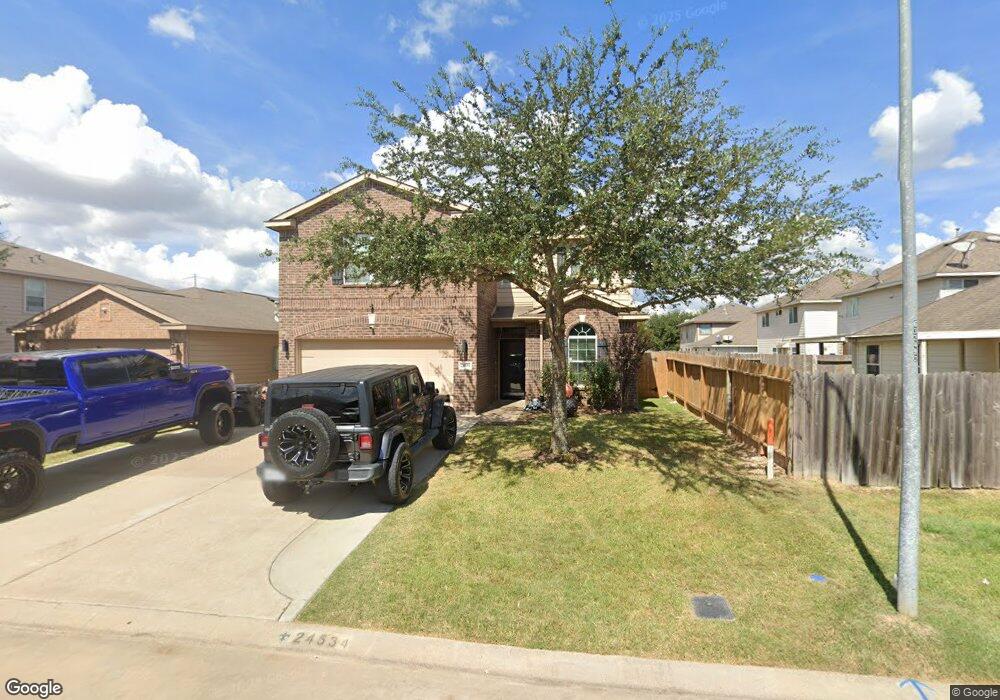
24534 Eagles Claw Dr Hockley, TX 77447
Hockley NeighborhoodEstimated Value: $287,429 - $323,000
5
Beds
3
Baths
2,538
Sq Ft
$117/Sq Ft
Est. Value
About This Home
This home is located at 24534 Eagles Claw Dr, Hockley, TX 77447 and is currently estimated at $297,607, approximately $117 per square foot. 24534 Eagles Claw Dr is a home located in Harris County with nearby schools including Roberts Road Elementary School, Waller Junior High School, and Waller High School.
Ownership History
Date
Name
Owned For
Owner Type
Purchase Details
Closed on
May 13, 2016
Sold by
Ruiz Olsen and Ruiz Kathryn Marti
Bought by
Robertson Kervin Desohn and Campbell Trina
Current Estimated Value
Home Financials for this Owner
Home Financials are based on the most recent Mortgage that was taken out on this home.
Original Mortgage
$187,956
Outstanding Balance
$149,869
Interest Rate
3.71%
Mortgage Type
VA
Estimated Equity
$147,738
Purchase Details
Closed on
Mar 24, 2014
Sold by
Lgi Homes Texas Llc
Bought by
Ruiz Olsen and Marti Ruiz Kathryn
Home Financials for this Owner
Home Financials are based on the most recent Mortgage that was taken out on this home.
Original Mortgage
$173,695
Interest Rate
4.32%
Mortgage Type
FHA
Create a Home Valuation Report for This Property
The Home Valuation Report is an in-depth analysis detailing your home's value as well as a comparison with similar homes in the area
Home Values in the Area
Average Home Value in this Area
Purchase History
| Date | Buyer | Sale Price | Title Company |
|---|---|---|---|
| Robertson Kervin Desohn | -- | Metropolitan Escrow & Title | |
| Ruiz Olsen | -- | Texas American Title Co |
Source: Public Records
Mortgage History
| Date | Status | Borrower | Loan Amount |
|---|---|---|---|
| Open | Robertson Kervin Desohn | $187,956 | |
| Previous Owner | Ruiz Olsen | $173,695 |
Source: Public Records
Tax History Compared to Growth
Tax History
| Year | Tax Paid | Tax Assessment Tax Assessment Total Assessment is a certain percentage of the fair market value that is determined by local assessors to be the total taxable value of land and additions on the property. | Land | Improvement |
|---|---|---|---|---|
| 2025 | $5,538 | $305,858 | $40,318 | $265,540 |
| 2024 | $5,538 | $303,281 | $40,318 | $262,963 |
| 2023 | $5,538 | $325,267 | $40,318 | $284,949 |
| 2022 | $6,481 | $274,499 | $34,526 | $239,973 |
| 2021 | $6,169 | $220,668 | $26,730 | $193,938 |
| 2020 | $5,957 | $206,349 | $26,730 | $179,619 |
| 2019 | $6,040 | $202,324 | $22,275 | $180,049 |
| 2018 | $1,347 | $190,164 | $20,356 | $169,808 |
| 2017 | $5,620 | $190,164 | $20,356 | $169,808 |
| 2016 | $5,620 | $190,164 | $20,356 | $169,808 |
| 2015 | -- | $190,164 | $20,356 | $169,808 |
| 2014 | -- | $0 | $0 | $0 |
Source: Public Records
Map
Nearby Homes
- 17222 Osprey Landing Dr
- 17135 Falcons Nest Landing Dr
- 24402 Bar Kay Ln
- 24503 Wild Horse Ln
- 24335 Palm Cockatoo Dr
- 24519 Cypresspark Glen Ln
- 24231 Wild Horse Ln
- 17247 Osprey Forest Dr
- 24303 Four Sixes Ln
- 2076 Stallion Lakes Ave
- 24211 Four Sixes Ln
- 24010 Palo Dura Dr
- 24402 Jumping Jay Dr
- 17506 Bullis Gap Dr
- 24310 Rockin Seven Dr
- 24414 Broken Bow Ln
- 0 Lazy Kay Ln
- 24039 Rockin Seven Dr
- 17607 Lavender Blossom Ln
- 17603 Lavender Blossom Ln
- 24538 Eagles Claw Dr
- 17219 Osprey Landing Dr
- 24542 Eagles Claw Dr
- 17227 Osprey Landing Dr
- 17223 Osprey Landing Dr
- 24543 Osprey Point Dr
- 17231 Osprey Landing Dr
- 17247 Osprey Landing Dr
- 24546 Eagles Claw Dr
- 24547 Osprey Point Dr
- 24551 Osprey Point Dr
- 17211 Osprey Landing Dr
- 17235 Osprey Landing Dr
- 24535 Eagles Claw Dr
- 24555 Osprey Point Dr
- 24539 Eagles Claw Dr
- 24550 Eagles Claw
- 24543 Eagles Claw Dr
- 17207 Osprey Landing Dr
- 24559 Osprey Point Dr