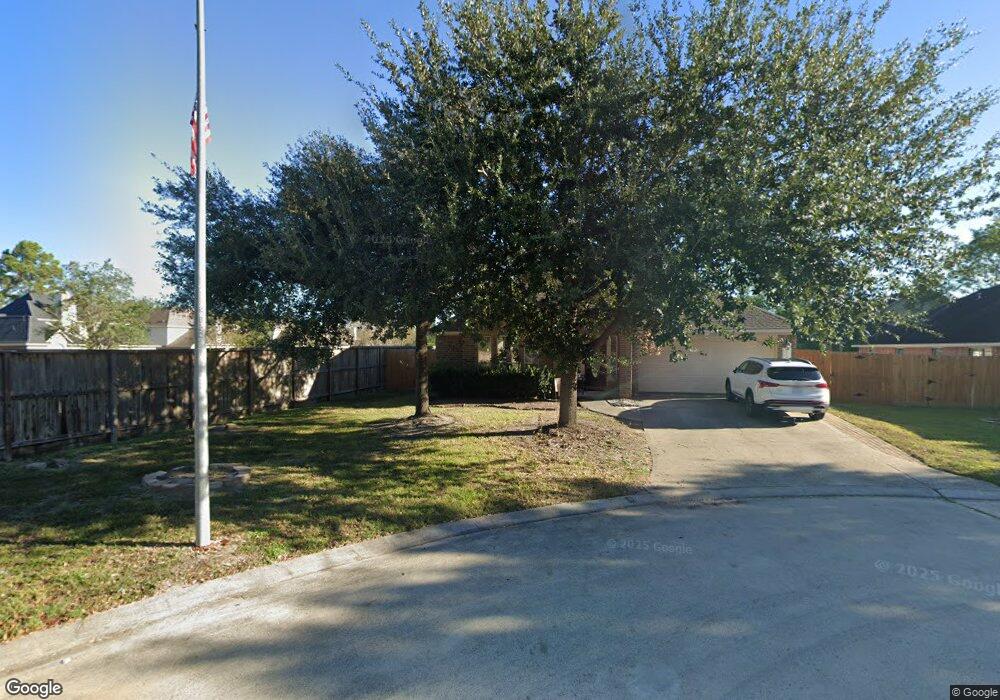
24538 Forest Path Ct Spring, TX 77373
Estimated Value: $272,105 - $293,000
3
Beds
2
Baths
2,152
Sq Ft
$131/Sq Ft
Est. Value
About This Home
This home is located at 24538 Forest Path Ct, Spring, TX 77373 and is currently estimated at $282,276, approximately $131 per square foot. 24538 Forest Path Ct is a home located in Harris County with nearby schools including John Winship Elementary School, Twin Creeks Middle School, and Spring High School.
Ownership History
Date
Name
Owned For
Owner Type
Purchase Details
Closed on
Aug 27, 2010
Sold by
Bank Of America National Association
Bought by
Skinner Richard D and Skinner Susan C
Current Estimated Value
Home Financials for this Owner
Home Financials are based on the most recent Mortgage that was taken out on this home.
Original Mortgage
$98,880
Outstanding Balance
$65,360
Interest Rate
4.46%
Mortgage Type
New Conventional
Estimated Equity
$216,916
Purchase Details
Closed on
Feb 2, 2010
Sold by
Oballe Rodolfo and Oballe Rebecca
Bought by
Bank Of America National Association
Purchase Details
Closed on
Dec 30, 2005
Sold by
D R Horton Texas Ltd
Bought by
Oballe Rodolfo and Oballe Rebecca
Home Financials for this Owner
Home Financials are based on the most recent Mortgage that was taken out on this home.
Original Mortgage
$122,069
Interest Rate
6.23%
Mortgage Type
Fannie Mae Freddie Mac
Create a Home Valuation Report for This Property
The Home Valuation Report is an in-depth analysis detailing your home's value as well as a comparison with similar homes in the area
Home Values in the Area
Average Home Value in this Area
Purchase History
| Date | Buyer | Sale Price | Title Company |
|---|---|---|---|
| Skinner Richard D | -- | Lsi Title Agency Inc | |
| Bank Of America National Association | $151,071 | None Available | |
| Oballe Rodolfo | -- | Dhi Title |
Source: Public Records
Mortgage History
| Date | Status | Borrower | Loan Amount |
|---|---|---|---|
| Open | Skinner Richard D | $98,880 | |
| Previous Owner | Oballe Rodolfo | $122,069 |
Source: Public Records
Tax History
| Year | Tax Paid | Tax Assessment Tax Assessment Total Assessment is a certain percentage of the fair market value that is determined by local assessors to be the total taxable value of land and additions on the property. | Land | Improvement |
|---|---|---|---|---|
| 2025 | $2,669 | $270,942 | $58,078 | $212,864 |
| 2024 | $2,669 | $304,023 | $58,078 | $245,945 |
| 2023 | $2,669 | $295,536 | $53,208 | $242,328 |
| 2022 | $6,128 | $286,906 | $32,225 | $254,681 |
| 2021 | $5,809 | $206,612 | $32,225 | $174,387 |
| 2020 | $6,057 | $204,370 | $32,225 | $172,145 |
| 2019 | $5,816 | $196,059 | $32,225 | $163,834 |
| 2018 | $4,463 | $172,784 | $32,225 | $140,559 |
| 2017 | $5,249 | $172,784 | $32,225 | $140,559 |
| 2016 | $5,249 | $172,784 | $32,225 | $140,559 |
| 2015 | $4,518 | $172,784 | $32,225 | $140,559 |
| 2014 | $4,518 | $156,161 | $32,225 | $123,936 |
Source: Public Records
Map
Nearby Homes
- 2619 Colony Haven Cir
- 2602 Fort Settlement Trail
- 24538 Fort Settlement Dr
- 2514 Broad Timbers Dr
- 24710 Fawn Ridge Forest Dr
- 24515 Flora Meadow Dr
- 24611 Fort Timbers Ct
- 2526 Spring Dusk Ln
- 2739 Barrington Branch Dr
- 26506 Cypresswood Dr
- 2306 Two Trail Dr
- 2227 Lazy Trail Path Ct
- 24714 Longwood Forest Dr
- 2402 Spring Dusk Ln
- 26619 Cypresswood Dr
- 24306 Spring Mill Ln
- 3330 Spring Creek Dr
- 2531 Goldspring Ln
- 2303 Spring Dusk Ln
- 2819 Bradbury Hills Dr
- 24534 Forest Path Ct
- 24702 Native Forest Ct
- 24703 Native Forest Ct
- 2603 Colony Haven Cir
- 24530 Forest Path Ct
- 24539 Forest Path Ct
- 24519 Split Rail Ridge
- 2518 Deer Forest Dr
- 24535 Forest Path Ct
- 24526 Forest Path Ct
- 2522 Deer Forest Dr
- 2518 Deer Forest Dr
- 2518 Deer Forest Dr
- 24531 Forest Path Ct
- 2522 Deer Forest Dr
- 2514 Deer Forest
- 2526 Deer Forest Dr
- 2607 Colony Haven Cir
- 24515 Split Rail Ridge
- 2526 Deer Forest
Your Personal Tour Guide
Ask me questions while you tour the home.