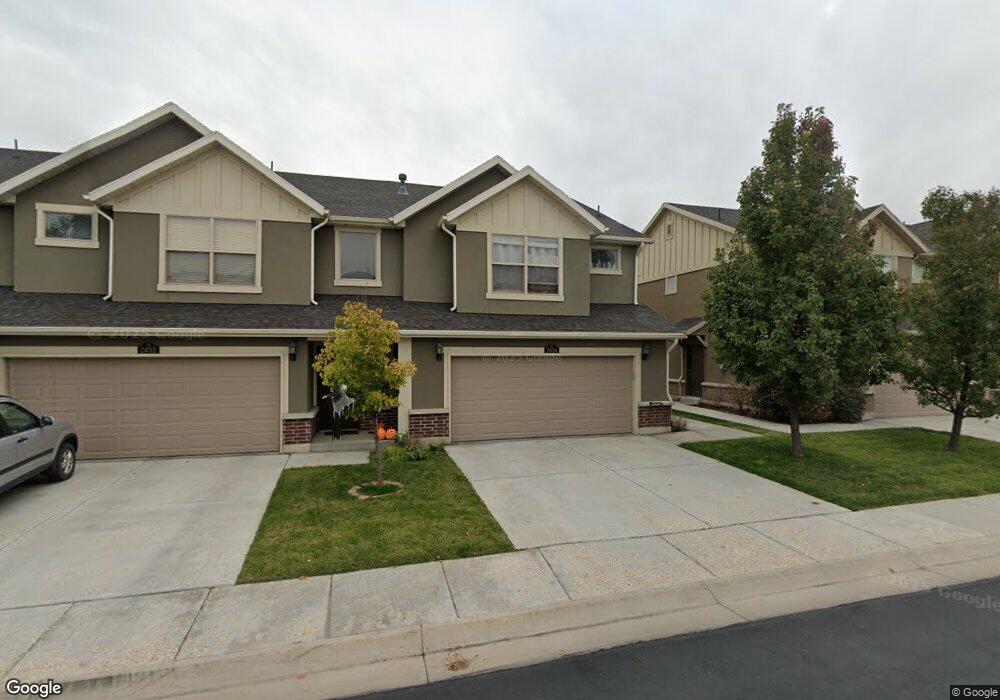
2454 S Andover St West Haven, UT 84401
Estimated Value: $335,000 - $351,000
3
Beds
3
Baths
1,328
Sq Ft
$259/Sq Ft
Est. Value
About This Home
This home is located at 2454 S Andover St, West Haven, UT 84401 and is currently estimated at $343,680, approximately $258 per square foot. 2454 S Andover St is a home located in Weber County with nearby schools including Kanesville Elementary School, Rocky Mountain Junior High School, and Fremont High School.
Ownership History
Date
Name
Owned For
Owner Type
Purchase Details
Closed on
Jun 15, 2023
Sold by
Anderson Tyler Scott and Huybregts Isabella
Bought by
Sherrod Phyllis and Gardiner Jared
Current Estimated Value
Home Financials for this Owner
Home Financials are based on the most recent Mortgage that was taken out on this home.
Original Mortgage
$80,000
Outstanding Balance
$77,861
Interest Rate
6.39%
Mortgage Type
New Conventional
Estimated Equity
$265,819
Purchase Details
Closed on
Jun 29, 2022
Sold by
Stephens Terrence J
Bought by
Anderson Tyler Scott and Huybreg Isabella
Home Financials for this Owner
Home Financials are based on the most recent Mortgage that was taken out on this home.
Original Mortgage
$20,619
Interest Rate
5.7%
Purchase Details
Closed on
Jun 28, 2021
Sold by
Stephens Terrence Josiah and Groveau Chelsea Roberta
Bought by
Stephens Terrence J and Groveau Chelsea R
Home Financials for this Owner
Home Financials are based on the most recent Mortgage that was taken out on this home.
Original Mortgage
$206,200
Interest Rate
2.9%
Mortgage Type
New Conventional
Purchase Details
Closed on
Aug 28, 2019
Sold by
Maycock Angela and Layton Launi
Bought by
Stephens Terrence Josiah and Groveau Chelsea Roberta
Home Financials for this Owner
Home Financials are based on the most recent Mortgage that was taken out on this home.
Original Mortgage
$207,100
Interest Rate
3.8%
Mortgage Type
New Conventional
Purchase Details
Closed on
Dec 22, 2016
Bought by
Maycock Angela
Home Financials for this Owner
Home Financials are based on the most recent Mortgage that was taken out on this home.
Original Mortgage
$159,556
Interest Rate
4.3%
Purchase Details
Closed on
Mar 20, 2012
Sold by
Destination Homes Inc
Bought by
Wall Brandon
Home Financials for this Owner
Home Financials are based on the most recent Mortgage that was taken out on this home.
Original Mortgage
$128,000
Interest Rate
3.84%
Mortgage Type
VA
Purchase Details
Closed on
Apr 23, 2010
Sold by
West Haven Holdings Llc
Bought by
Destination Homes Inc
Home Financials for this Owner
Home Financials are based on the most recent Mortgage that was taken out on this home.
Original Mortgage
$827,500
Interest Rate
4.91%
Mortgage Type
Purchase Money Mortgage
Create a Home Valuation Report for This Property
The Home Valuation Report is an in-depth analysis detailing your home's value as well as a comparison with similar homes in the area
Home Values in the Area
Average Home Value in this Area
Purchase History
| Date | Buyer | Sale Price | Title Company |
|---|---|---|---|
| Sherrod Phyllis | -- | Stewart Title | |
| Anderson Tyler Scott | -- | Metro National Title | |
| Stephens Terrence J | -- | First Amer Fashion Pointe | |
| Stephens Terrence Josiah | -- | Stewart Title Ins Agcy Of Ut | |
| Maycock Angela | -- | -- | |
| Wall Brandon | -- | Bonneville Superior Title Co | |
| Destination Homes Inc | -- | Bonneville Superior Title Co |
Source: Public Records
Mortgage History
| Date | Status | Borrower | Loan Amount |
|---|---|---|---|
| Open | Sherrod Phyllis | $80,000 | |
| Previous Owner | Anderson Tyler Scott | $20,619 | |
| Previous Owner | Anderson Tyler Scott | $343,660 | |
| Previous Owner | Stephens Terrence J | $206,200 | |
| Previous Owner | Stephens Terrence Josiah | $207,100 | |
| Previous Owner | Maycock Angela | $159,556 | |
| Previous Owner | Maycock Angela | -- | |
| Previous Owner | Wall Brandon | $128,000 | |
| Previous Owner | Destination Homes Inc | $827,500 |
Source: Public Records
Tax History Compared to Growth
Tax History
| Year | Tax Paid | Tax Assessment Tax Assessment Total Assessment is a certain percentage of the fair market value that is determined by local assessors to be the total taxable value of land and additions on the property. | Land | Improvement |
|---|---|---|---|---|
| 2025 | $1,857 | $334,453 | $80,000 | $254,453 |
| 2024 | $1,820 | $183,700 | $44,000 | $139,700 |
| 2023 | $1,760 | $176,000 | $44,000 | $132,000 |
| 2022 | $1,715 | $175,450 | $44,000 | $131,450 |
| 2021 | $1,459 | $253,000 | $30,000 | $223,000 |
| 2020 | $1,364 | $217,000 | $30,000 | $187,000 |
| 2019 | $1,369 | $206,000 | $30,000 | $176,000 |
| 2018 | $1,256 | $181,000 | $30,988 | $150,012 |
| 2017 | $1,071 | $150,000 | $30,647 | $119,353 |
| 2016 | $994 | $75,350 | $13,673 | $61,677 |
| 2015 | $978 | $73,150 | $13,673 | $59,477 |
| 2014 | $971 | $70,950 | $13,673 | $57,277 |
Source: Public Records
Map
Nearby Homes
- 2444 S Andover St Unit 331
- 2448 S Andover St Unit 333
- 2455 Gilmour St
- 2488 S Andover St
- 2307 W 2525 S
- 2496 S 2355 W
- 2664 S 2250 St W Unit 202
- 2667 S 2300 St W Unit 255
- 2274 W 2710 S Unit 273
- 2274 W 2710 S Unit 271
- 3417 2730 S Unit 2
- 2901 S 1900 W
- 1882 S 2475 W
- 2300 Farmhouse Select Plan at Fairhaven
- 1856 S 2425 W
- 1918 S 2475 W
- 1903 S 2425 W
- 1977 S 2425 W
- 2067 S 2425 W
- 2050 Farmhouse Select Plan at Fairhaven
- 2454 S Andover St Unit 335
- 2452 S Andover St
- 2460 S Andover St Unit 336
- 2466 S Andover St Unit 338
- 2444 S Andover St
- 2457 S Andover St Unit 307
- 2453 S Andover St
- 2453 S Andover St Unit 308
- 2449 S Andover St Unit 309
- 2470 S Andover St Unit 339
- 2447 S Andover St Unit 310
- 2440 S Andover St Unit 330
- 2440 S Andover St
- 2465 S Andover St Unit 305
- 2440 Andover St
- 2445 S Andover St Unit 311
- 2445 S Andover St
- 2467 S Andover St Unit 304
- 2467 S Andover St
- 2472 S Andover St Unit 340