2454 Stoney End Ct Florissant, MO 63031
Estimated Value: $175,000 - $186,000
3
Beds
2
Baths
1,189
Sq Ft
$154/Sq Ft
Est. Value
About This Home
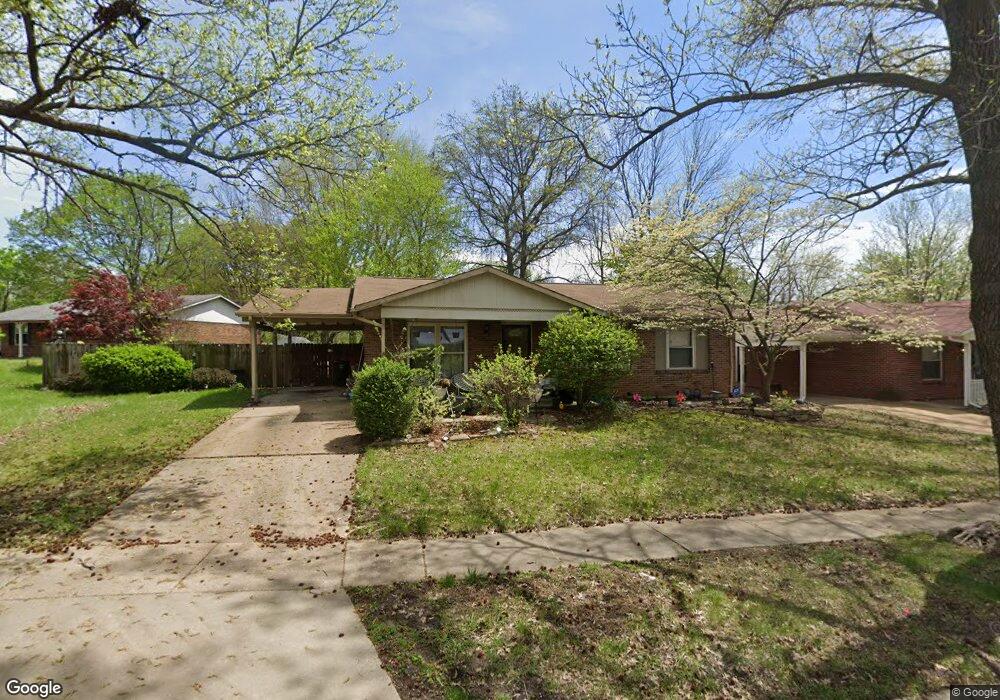
This home is located at 2454 Stoney End Ct, Florissant, MO 63031 and is currently estimated at $182,648, approximately $153 per square foot. 2454 Stoney End Ct is a home located in St. Louis County with nearby schools including Walker Elementary School, Northwest Middle School, and Hazelwood West High School.
Ownership History
Date
Name
Owned For
Owner Type
Purchase Details
Closed on
Aug 27, 2004
Sold by
Hodge Lisa A and Hodge Rick H
Bought by
Gillespie Anissa M
Current Estimated Value
Home Financials for this Owner
Home Financials are based on the most recent Mortgage that was taken out on this home.
Original Mortgage
$116,082
Outstanding Balance
$57,869
Interest Rate
6.08%
Mortgage Type
FHA
Estimated Equity
$124,779
Purchase Details
Closed on
May 23, 1997
Sold by
Russell Lisa A and Russell Lisa A
Bought by
Hodge Lisa A and Hodge Rick H
Home Financials for this Owner
Home Financials are based on the most recent Mortgage that was taken out on this home.
Original Mortgage
$62,400
Interest Rate
7.98%
Purchase Details
Closed on
Feb 1, 1995
Sold by
Russell Ronald C
Bought by
Russell Lisa A and Hodge Lisa A
Create a Home Valuation Report for This Property
The Home Valuation Report is an in-depth analysis detailing your home's value as well as a comparison with similar homes in the area
Home Values in the Area
Average Home Value in this Area
Purchase History
| Date | Buyer | Sale Price | Title Company |
|---|---|---|---|
| Gillespie Anissa M | $117,000 | -- | |
| Hodge Lisa A | -- | -- | |
| Russell Lisa A | -- | -- |
Source: Public Records
Mortgage History
| Date | Status | Borrower | Loan Amount |
|---|---|---|---|
| Open | Gillespie Anissa M | $116,082 | |
| Previous Owner | Hodge Lisa A | $62,400 |
Source: Public Records
Tax History Compared to Growth
Tax History
| Year | Tax Paid | Tax Assessment Tax Assessment Total Assessment is a certain percentage of the fair market value that is determined by local assessors to be the total taxable value of land and additions on the property. | Land | Improvement |
|---|---|---|---|---|
| 2025 | $2,450 | $31,260 | $6,670 | $24,590 |
| 2024 | $2,450 | $28,010 | $3,820 | $24,190 |
| 2023 | $2,450 | $28,010 | $3,820 | $24,190 |
| 2022 | $2,186 | $22,270 | $4,390 | $17,880 |
| 2021 | $2,154 | $22,270 | $4,390 | $17,880 |
| 2020 | $1,840 | $17,670 | $4,390 | $13,280 |
| 2019 | $1,812 | $17,670 | $4,390 | $13,280 |
| 2018 | $1,608 | $14,390 | $2,700 | $11,690 |
| 2017 | $1,606 | $14,390 | $2,700 | $11,690 |
| 2016 | $1,682 | $14,880 | $3,080 | $11,800 |
| 2015 | $1,646 | $14,880 | $3,080 | $11,800 |
| 2014 | $1,786 | $16,660 | $4,330 | $12,330 |
Source: Public Records
Map
Nearby Homes
- 2042 Farflung Dr
- 2618 Freemantle Dr
- 2347 Farflung Dr
- 2106 Kingsford Dr
- 2314 Stoney End Ct
- 2112 Millvalley Dr
- 2437 Periwinkle Ct
- 2235 Central Parkway Dr
- 1834 Night Dr
- 2216 Foggy Bottom Dr
- 1907 High Sun Dr
- 1920 High Sun Dr
- 1885 High Sun Dr
- 1863 High Sun Dr Unit 51863
- 2515 Flamingo Dr
- 2112 New Sun Dr
- 1831 New Sun Ct Unit 5
- 2048 New Sun Dr
- 1830 New Sun Ct
- 1920 Shackelford Rd
- 2464 Stoney End Ct
- 2434 Stoney End Ct
- 2455 Stoney End Ct
- 2445 Stoney End Ct
- 2474 Stoney End Ct
- 2435 Stoney End Ct
- 2424 Stoney End Ct
- 2475 Stoney End Ct
- 2484 Stoney End Ct
- 2425 Stoney End Ct
- 2485 Stoney End Ct
- 2165 Kingsford Dr
- 2185 Kingsford Dr
- 2415 Stoney End Ct
- 2155 Kingsford Dr
- 2145 Kingsford Dr
- 2217 Kingsford Dr
- 2346 Millvalley Dr
- 2356 Millvalley Dr