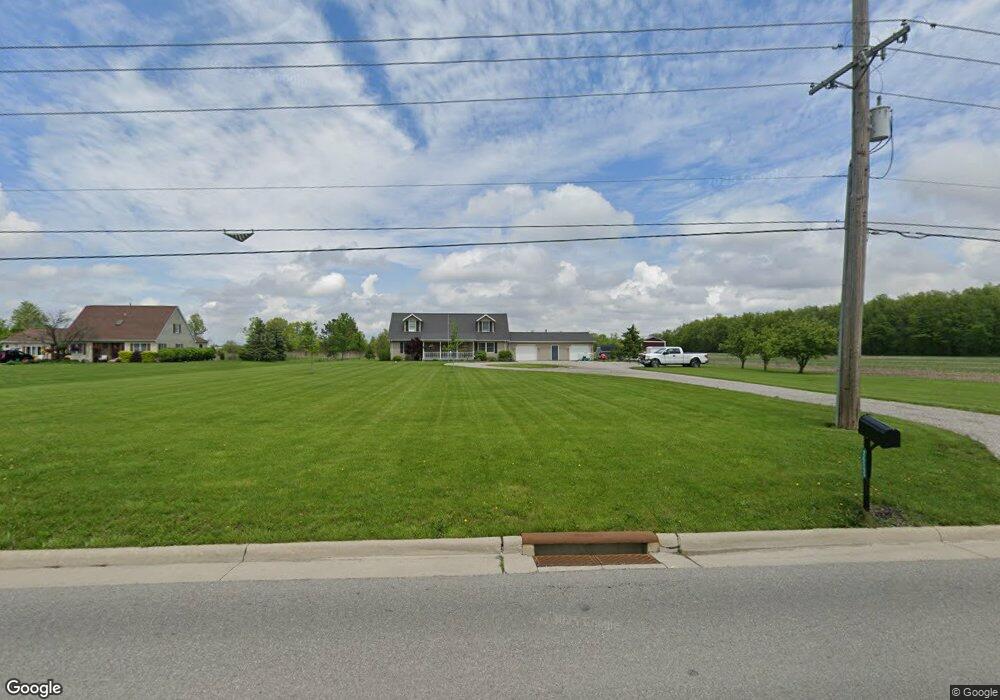
24545 Elliott Rd Defiance, OH 43512
Estimated Value: $250,000 - $364,000
3
Beds
3
Baths
1,750
Sq Ft
$166/Sq Ft
Est. Value
About This Home
This home is located at 24545 Elliott Rd, Defiance, OH 43512 and is currently estimated at $290,501, approximately $166 per square foot. 24545 Elliott Rd is a home located in Defiance County with nearby schools including Noble Elementary School, Tinora Elementary School, and Tinora Middle School.
Ownership History
Date
Name
Owned For
Owner Type
Purchase Details
Closed on
Jun 19, 2008
Sold by
Miller Terry L and Miller Amy J
Bought by
Huner Ronald L and Huner Amy S
Current Estimated Value
Home Financials for this Owner
Home Financials are based on the most recent Mortgage that was taken out on this home.
Original Mortgage
$120,000
Outstanding Balance
$77,475
Interest Rate
6.17%
Mortgage Type
New Conventional
Estimated Equity
$213,026
Purchase Details
Closed on
Jan 14, 2005
Sold by
Luessenhop Sondra S and Davis Sondra S
Bought by
Miller Terry L
Home Financials for this Owner
Home Financials are based on the most recent Mortgage that was taken out on this home.
Original Mortgage
$122,400
Interest Rate
5.77%
Mortgage Type
New Conventional
Purchase Details
Closed on
Feb 18, 2000
Bought by
Huner Ronald L and Huner Amy S
Purchase Details
Closed on
Dec 1, 1991
Bought by
Huner Ronald L and Huner Amy S
Create a Home Valuation Report for This Property
The Home Valuation Report is an in-depth analysis detailing your home's value as well as a comparison with similar homes in the area
Home Values in the Area
Average Home Value in this Area
Purchase History
| Date | Buyer | Sale Price | Title Company |
|---|---|---|---|
| Huner Ronald L | $112,500 | -- | |
| Miller Terry L | $1,147,500 | None Available | |
| Huner Ronald L | $133,000 | -- | |
| Huner Ronald L | $12,000 | -- |
Source: Public Records
Mortgage History
| Date | Status | Borrower | Loan Amount |
|---|---|---|---|
| Open | Huner Ronald L | $120,000 | |
| Previous Owner | Miller Terry L | $122,400 |
Source: Public Records
Tax History Compared to Growth
Tax History
| Year | Tax Paid | Tax Assessment Tax Assessment Total Assessment is a certain percentage of the fair market value that is determined by local assessors to be the total taxable value of land and additions on the property. | Land | Improvement |
|---|---|---|---|---|
| 2024 | $2,448 | $70,060 | $10,600 | $59,460 |
| 2023 | $2,448 | $70,060 | $10,600 | $59,460 |
| 2022 | $2,405 | $57,930 | $9,300 | $48,630 |
| 2021 | $2,405 | $57,930 | $9,300 | $48,630 |
| 2020 | $2,397 | $57,930 | $9,300 | $48,630 |
| 2019 | $2,175 | $53,690 | $8,890 | $44,800 |
| 2018 | $2,230 | $53,690 | $8,890 | $44,800 |
| 2017 | $2,270 | $53,683 | $8,886 | $44,797 |
| 2016 | $1,752 | $47,012 | $7,934 | $39,078 |
| 2015 | $894 | $46,357 | $7,934 | $38,423 |
| 2014 | $894 | $46,357 | $7,934 | $38,423 |
| 2013 | $894 | $46,357 | $7,934 | $38,423 |
| 2012 | $894 | $46,358 | $7,935 | $38,423 |
Source: Public Records
Map
Nearby Homes
- 205 Stadium Dr
- 8208 N State Route 66 Unit 8219
- 16 College Place
- 1102 Anthony Wayne Blvd
- 1275 Pinehurst Dr
- 558 Gibson St
- 230 Adams St
- 202 Southworth St
- 850 Deerwood Dr
- 846 Deerwood Dr
- 679 Burning Tree Dr
- 673 Burning Tree Dr
- 655 Burning Tree Dr
- 649 Burning Tree Dr
- 1365 Heatherdowns Dr
- 1408 Heatherdowns Dr
- 1459 Deerwood Dr
- 415 Fort St
- 202 Wilson St
- 588 Fugate Dr
- 24515 Elliott Rd
- 24467 Elliott Rd
- 24400 Elliott Rd
- 24335 Elliott Rd
- 24375 Elliott Rd
- 24265 Elliott Rd
- 24851 Elliott Rd
- 24241 Elliott Rd
- 24881 Elliott Rd
- 24857 Elliott Rd
- 1995 N Clinton St
- 1225 Carpenter Rd
- 1255 Carpenter Rd
- 1100 Carpenter Rd
- 0 N Us St Rt 66
- 0 N State Route 66
- 8567 Carpenter Rd
- Sec 13 Stadium Dr
- 8846 N State Route 66
- 8896 N Sr 66