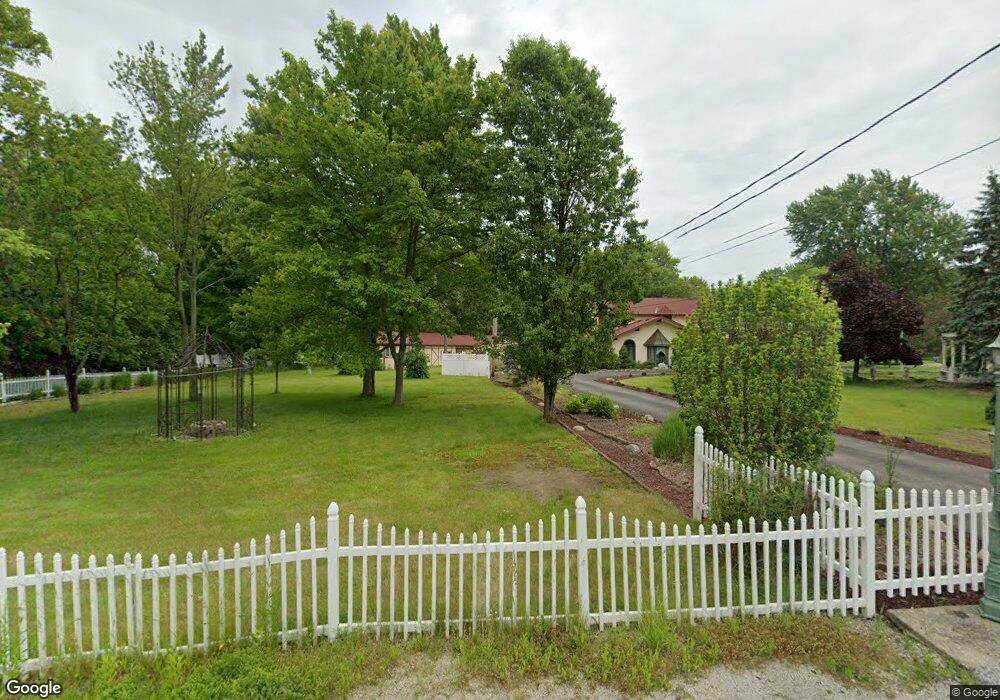
24546 Nobottom Rd Olmsted, OH 44138
Estimated Value: $462,000 - $532,836
3
Beds
1
Bath
3,546
Sq Ft
$137/Sq Ft
Est. Value
About This Home
This home is located at 24546 Nobottom Rd, Olmsted, OH 44138 and is currently estimated at $484,209, approximately $136 per square foot. 24546 Nobottom Rd is a home located in Cuyahoga County with nearby schools including Falls-Lenox Primary Elementary School, Olmsted Falls Intermediate Building, and Olmsted Falls Middle School.
Ownership History
Date
Name
Owned For
Owner Type
Purchase Details
Closed on
Apr 15, 2025
Sold by
Carrington Mortgage Services Llc
Bought by
Elmore Thomas G and Elmore Casey
Current Estimated Value
Purchase Details
Closed on
Mar 17, 2025
Sold by
Sheriff Of Cuyahoga County
Bought by
Carrington Mortgage Services Llc
Purchase Details
Closed on
Jun 30, 2020
Sold by
Hoislbauer William I
Bought by
Hoislbauer Judith Kay
Purchase Details
Closed on
Dec 12, 2012
Sold by
Three Bills Inc
Bought by
Hoislbauer William I and Hoislbauer Judith K
Purchase Details
Closed on
Feb 20, 2007
Sold by
Hydock William T and Hydock Patricia S
Bought by
Three Bills Inc
Purchase Details
Closed on
Oct 3, 1980
Sold by
Chester Zaremba
Bought by
Hydock William T
Purchase Details
Closed on
Jun 8, 1979
Sold by
Zaremba Chester and Zaremba Stella
Bought by
Chester Zaremba
Purchase Details
Closed on
Jan 1, 1975
Bought by
Zaremba Chester and Zaremba Stella
Create a Home Valuation Report for This Property
The Home Valuation Report is an in-depth analysis detailing your home's value as well as a comparison with similar homes in the area
Home Values in the Area
Average Home Value in this Area
Purchase History
| Date | Buyer | Sale Price | Title Company |
|---|---|---|---|
| Elmore Thomas G | $452,000 | None Listed On Document | |
| Carrington Mortgage Services Llc | $670,636 | None Listed On Document | |
| Hoislbauer Judith Kay | -- | None Available | |
| Hoislbauer William I | -- | Attorney | |
| Three Bills Inc | $107,500 | None Available | |
| Hydock William T | $53,900 | -- | |
| Chester Zaremba | -- | -- | |
| Zaremba Chester | -- | -- |
Source: Public Records
Tax History Compared to Growth
Tax History
| Year | Tax Paid | Tax Assessment Tax Assessment Total Assessment is a certain percentage of the fair market value that is determined by local assessors to be the total taxable value of land and additions on the property. | Land | Improvement |
|---|---|---|---|---|
| 2024 | $13,124 | $176,750 | $24,920 | $151,830 |
| 2023 | $12,587 | $131,285 | $24,395 | $106,890 |
| 2022 | $10,743 | $131,285 | $24,395 | $106,890 |
| 2021 | $11,688 | $131,290 | $24,400 | $106,890 |
| 2020 | $11,000 | $110,320 | $20,510 | $89,810 |
| 2019 | $10,034 | $315,200 | $58,600 | $256,600 |
| 2018 | $9,623 | $110,320 | $20,510 | $89,810 |
| 2017 | $8,613 | $91,080 | $17,750 | $73,330 |
| 2016 | $8,579 | $91,080 | $17,750 | $73,330 |
| 2015 | $7,984 | $91,080 | $17,750 | $73,330 |
| 2014 | $7,984 | $91,080 | $17,750 | $73,330 |
Source: Public Records
Map
Nearby Homes
- 7587 Lewis Rd
- 0 River Rd Unit 5169658
- 260 Stone Ridge Way
- 228 Stone Ridge Way
- 281-12-007 River Rd
- 281-12-024 River Rd
- 136 River Rock Way Unit D
- 7030 Columbia Rd
- 100 River Rock Way
- 7593 Columbia Rd
- 3 Dogwood Ln
- 109 Marble Ct
- V/L Columbia Rd
- 25725 Cook Rd
- 5 Hawthorn Dr
- 351 Lombardy Dr
- 361 Chestnut Dr
- 11 Brookins Dr
- 55 Patio Ln
- 8241 Lewis Rd
- 7561 Lewis Rd
- 7545 Lewis Rd
- 24542 Nobottom Rd
- 7569 Lewis Rd
- 7541 Lewis Rd
- 24540 Nobottom Rd
- 24545 Nobottom Rd
- V/L Lewis Rd
- 7537 Lewis Rd
- 7568 Lewis Rd
- 7525 Lewis Rd
- 7520 Lewis Rd
- 7506 Lewis Rd
- 665 Nobottom Rd
- 7560 Lewis Rd
- 325 Sandstone Ridge Way
- 7521 Lewis Rd
- 7576 Lewis Rd
- 7583 Lewis Rd
- 7578 Lewis Rd