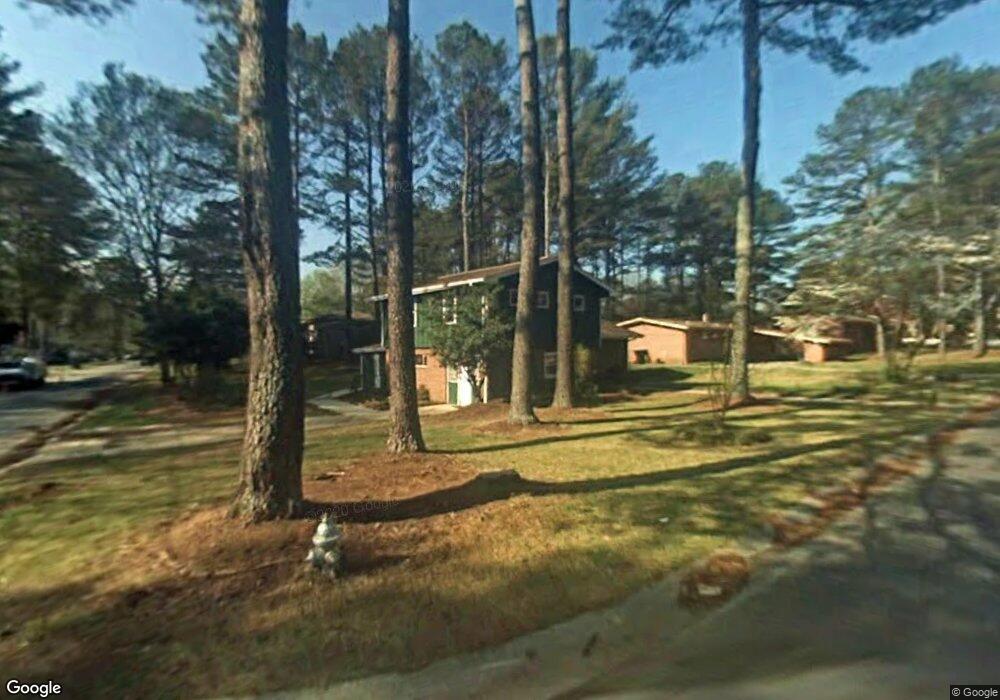
2455 Castile Dr Unit 2 Morrow, GA 30260
Estimated Value: $134,000 - $190,000
3
Beds
2
Baths
1,412
Sq Ft
$116/Sq Ft
Est. Value
About This Home
This home is located at 2455 Castile Dr Unit 2, Morrow, GA 30260 and is currently estimated at $163,629, approximately $115 per square foot. 2455 Castile Dr Unit 2 is a home located in Clayton County with nearby schools including William M. Mcgarrah Elementary School, Morrow Middle School, and Morrow High School.
Ownership History
Date
Name
Owned For
Owner Type
Purchase Details
Closed on
Jan 11, 2025
Sold by
Chu Quang Vinh
Bought by
Chu Thuy
Current Estimated Value
Purchase Details
Closed on
Mar 2, 2023
Sold by
Lu Nguyet
Bought by
Chu Thuy and Chu My
Purchase Details
Closed on
May 1, 2018
Sold by
Burns Mable Ann
Bought by
Lu Nguyet
Purchase Details
Closed on
Aug 26, 2005
Sold by
Clamer George R
Bought by
Shepherd Charles F
Home Financials for this Owner
Home Financials are based on the most recent Mortgage that was taken out on this home.
Original Mortgage
$83,950
Interest Rate
5.77%
Mortgage Type
New Conventional
Purchase Details
Closed on
Jun 29, 2001
Sold by
Callaway Charles A
Bought by
Burns Cara and Burns Mable A
Home Financials for this Owner
Home Financials are based on the most recent Mortgage that was taken out on this home.
Original Mortgage
$103,174
Interest Rate
7.08%
Mortgage Type
FHA
Create a Home Valuation Report for This Property
The Home Valuation Report is an in-depth analysis detailing your home's value as well as a comparison with similar homes in the area
Home Values in the Area
Average Home Value in this Area
Purchase History
| Date | Buyer | Sale Price | Title Company |
|---|---|---|---|
| Chu Thuy | $135,000 | -- | |
| Chu Thuy | -- | -- | |
| Lu Nguyet | $81,500 | -- | |
| Shepherd Charles F | $67,000 | -- | |
| Burns Cara | $104,000 | -- |
Source: Public Records
Mortgage History
| Date | Status | Borrower | Loan Amount |
|---|---|---|---|
| Previous Owner | Shepherd Charles F | $83,950 | |
| Previous Owner | Burns Cara | $103,174 |
Source: Public Records
Tax History
| Year | Tax Paid | Tax Assessment Tax Assessment Total Assessment is a certain percentage of the fair market value that is determined by local assessors to be the total taxable value of land and additions on the property. | Land | Improvement |
|---|---|---|---|---|
| 2025 | $2,494 | $65,120 | $8,000 | $57,120 |
| 2024 | $2,556 | $65,520 | $8,000 | $57,520 |
| 2023 | $2,187 | $60,560 | $8,000 | $52,560 |
| 2022 | $2,046 | $52,120 | $8,000 | $44,120 |
| 2021 | $1,526 | $38,640 | $8,000 | $30,640 |
| 2020 | $1,463 | $36,574 | $8,000 | $28,574 |
| 2019 | $1,332 | $32,817 | $6,400 | $26,417 |
| 2018 | $1,089 | $26,820 | $6,400 | $20,420 |
| 2017 | $949 | $23,317 | $6,400 | $16,917 |
| 2016 | $276 | $22,796 | $6,400 | $16,396 |
| 2015 | $160 | $0 | $0 | $0 |
| 2014 | $188 | $19,475 | $6,400 | $13,075 |
Source: Public Records
Map
Nearby Homes
- 6463 Maddox Rd
- 2497 Celina Ct
- 6413 Maddox Rd
- 6560 Maddox Rd
- 2455 Lake Harbin Rd
- 6359 Lanier Rd
- 2617 Terrace Pkwy
- 2575 Stratford Ln
- 2613 Stratford Ln Unit 3
- 6584 Sleepy Hollow Ln
- 2514 Harbin Village Ct
- 6380 Mount Zion Blvd
- 6566 Melandre Dr
- 6200 Fieldcrest Dr Unit 3
- 6397 E Meyer Dr
- 6203 Castlewood Dr
- 6205 Fieldcrest Dr
- 6155 Landover Cir Unit 2
- 6495 Revena Dr
- 6227 Mount Zion Blvd
- 2447 Castile Dr
- 6457 Rabun Rd
- 2469 Castile Dr
- 2439 Castile Dr
- 2454 Castile Dr
- 6456 Rabun Rd
- 2460 Castile Dr
- 6465 Rabun Rd
- 2446 Castile Dr
- 2475 Castile Dr
- 2475 Castile Dr
- 2431 Castile Dr
- 2468 Castile Dr Unit 2468
- 2468 Castile Dr
- 6464 Rabun Rd
- 6464 Rabun Rd Unit 117
- 6464 Rabun Road 0 Unit 117
- 2438 Castile Dr
- 6473 Rabun Rd
- 6458 Sinclair Place
Your Personal Tour Guide
Ask me questions while you tour the home.