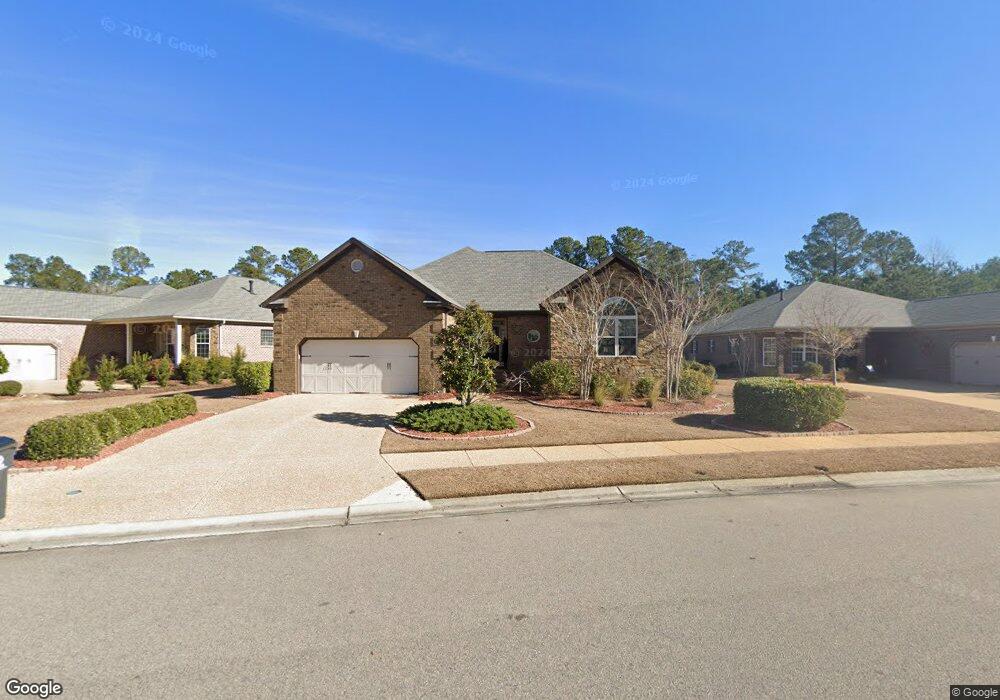
2456 Belshaw Dr Leland, NC 28451
Estimated Value: $489,661 - $586,000
3
Beds
3
Baths
1,887
Sq Ft
$281/Sq Ft
Est. Value
About This Home
This home is located at 2456 Belshaw Dr, Leland, NC 28451 and is currently estimated at $531,165, approximately $281 per square foot. 2456 Belshaw Dr is a home located in Brunswick County with nearby schools including Town Creek Elementary School and North Brunswick High School.
Ownership History
Date
Name
Owned For
Owner Type
Purchase Details
Closed on
Dec 30, 2016
Sold by
Bobeck Duane R and Innocenti Marsha A
Bought by
Bobeck Duane R
Current Estimated Value
Purchase Details
Closed on
Sep 8, 2010
Sold by
Funston Land & Timber Llc
Bought by
Trusst Builders Inc
Home Financials for this Owner
Home Financials are based on the most recent Mortgage that was taken out on this home.
Original Mortgage
$271,600
Outstanding Balance
$178,616
Interest Rate
4.36%
Mortgage Type
Construction
Estimated Equity
$352,549
Purchase Details
Closed on
Sep 7, 2010
Sold by
Trusst Builders Inc
Bought by
Robeck Duane R and Innocenti Marsha A
Home Financials for this Owner
Home Financials are based on the most recent Mortgage that was taken out on this home.
Original Mortgage
$271,600
Outstanding Balance
$178,616
Interest Rate
4.36%
Mortgage Type
Construction
Estimated Equity
$352,549
Create a Home Valuation Report for This Property
The Home Valuation Report is an in-depth analysis detailing your home's value as well as a comparison with similar homes in the area
Home Values in the Area
Average Home Value in this Area
Purchase History
| Date | Buyer | Sale Price | Title Company |
|---|---|---|---|
| Bobeck Duane R | -- | None Available | |
| Trusst Builders Inc | $87,500 | None Available | |
| Robeck Duane R | $149,500 | None Available |
Source: Public Records
Mortgage History
| Date | Status | Borrower | Loan Amount |
|---|---|---|---|
| Open | Trusst Builders Inc | $271,600 | |
| Closed | Robeck Duane R | $271,600 |
Source: Public Records
Tax History Compared to Growth
Tax History
| Year | Tax Paid | Tax Assessment Tax Assessment Total Assessment is a certain percentage of the fair market value that is determined by local assessors to be the total taxable value of land and additions on the property. | Land | Improvement |
|---|---|---|---|---|
| 2025 | $3,035 | $463,200 | $125,000 | $338,200 |
| 2024 | $3,035 | $463,200 | $125,000 | $338,200 |
| 2023 | $2,381 | $463,200 | $125,000 | $338,200 |
| 2022 | $2,381 | $301,510 | $105,000 | $196,510 |
| 2021 | $2,381 | $301,510 | $105,000 | $196,510 |
| 2020 | $2,260 | $301,510 | $105,000 | $196,510 |
| 2019 | $2,245 | $106,520 | $105,000 | $1,520 |
| 2018 | $2,207 | $81,760 | $80,000 | $1,760 |
| 2017 | $2,207 | $81,760 | $80,000 | $1,760 |
| 2016 | $2,102 | $81,760 | $80,000 | $1,760 |
| 2015 | $2,007 | $299,550 | $80,000 | $219,550 |
| 2014 | $1,849 | $294,420 | $80,000 | $214,420 |
Source: Public Records
Map
Nearby Homes
- 2172 Villamar Dr
- 2143 Villamar Dr
- 1101 Jamesford Ct
- 1177 Lillibridge Dr
- 2115 Villamar Dr
- 2244 Villamar Dr
- 2019 Annsdale Dr N
- 2170 Talmage Dr
- 3729 Anslow Dr
- 1413 W Gantry Ct
- 1105 Charlton Way
- 3284 Gardenwood Dr
- 2129 Talmage Dr
- 2123 Talmage Dr
- 5225 National Garden Trail
- 2329 Jasper Forest Trail
- 3781 Anslow Dr
- 2089 Simmerman Way
- 1127 Walbury Ct
- 1715 S Stillwood Dr
- 2612 Vickery Cove
- 2452 Belshaw Dr
- 2616 Vickery Cove
- 2448 Belshaw Dr
- 2453 Belshaw Dr
- 2620 Vickery Cove
- 2455 Belshaw Dr
- 2444 Belshaw Dr
- 2449 Belshaw Dr
- 2457 Belshaw Dr
- 2624 Vickery Cove
- 2445 Belshaw Dr
- 2459 Belshaw Dr
- 2440 Belshaw Dr
- 2441 Belshaw Dr
- 2164 Villamar Dr
- 2160 Villamar Dr
- 2461 Belshaw Dr
- 2436 Belshaw Dr
- 2168 Villamar Dr