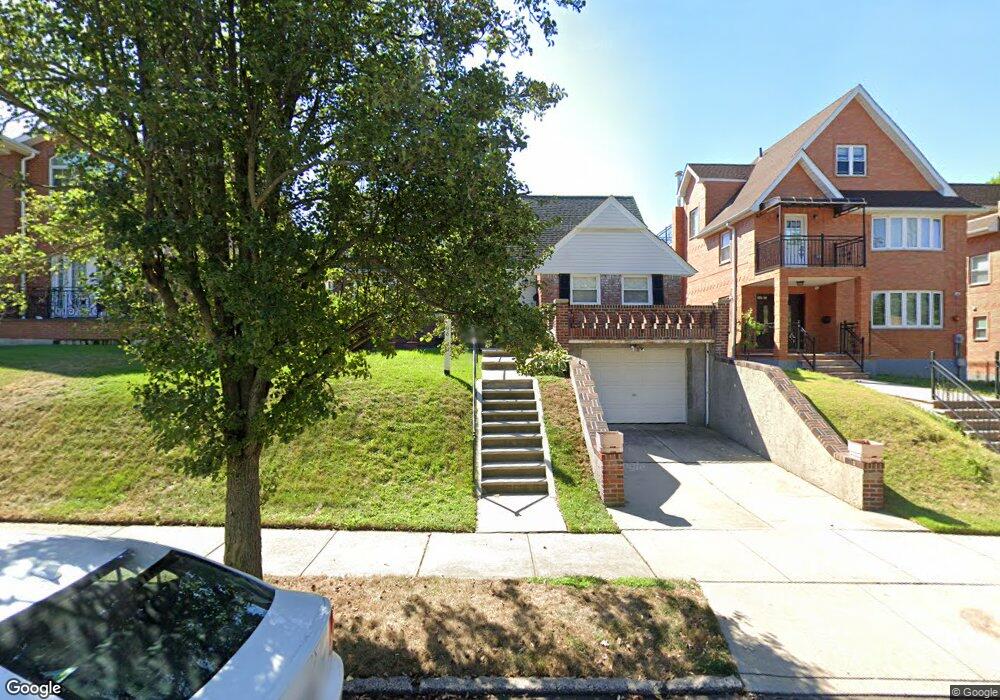
24566 63rd Ave Little Neck, NY 11362
Douglaston NeighborhoodEstimated Value: $985,000 - $1,208,000
--
Bed
--
Bath
1,056
Sq Ft
$1,044/Sq Ft
Est. Value
About This Home
This home is located at 24566 63rd Ave, Little Neck, NY 11362 and is currently estimated at $1,102,305, approximately $1,043 per square foot. 24566 63rd Ave is a home located in Queens County with nearby schools including P.S. 221Q The North Hills School, Louis Pasteur Middle School 67, and Benjamin N Cardozo High School.
Ownership History
Date
Name
Owned For
Owner Type
Purchase Details
Closed on
May 12, 2023
Sold by
Kim Favale As Co-Trustee and Lisa Morris As Co-Trustee
Bought by
Hom Wendy L and Tse Andrew
Current Estimated Value
Home Financials for this Owner
Home Financials are based on the most recent Mortgage that was taken out on this home.
Original Mortgage
$768,000
Outstanding Balance
$744,532
Interest Rate
6.28%
Mortgage Type
Purchase Money Mortgage
Estimated Equity
$357,773
Purchase Details
Closed on
Nov 6, 2020
Sold by
Behnken 2018 Family Trust and Kim Favale As Trustee
Bought by
Behnken 2018 Family Trust and Kim Favale As Co-Trustee
Purchase Details
Closed on
Aug 30, 2018
Sold by
Behnken Mary and Estate Of John H Behnken Deceased
Bought by
Behnken 2017 Family Trust and Favale As Trustee Kim
Create a Home Valuation Report for This Property
The Home Valuation Report is an in-depth analysis detailing your home's value as well as a comparison with similar homes in the area
Home Values in the Area
Average Home Value in this Area
Purchase History
| Date | Buyer | Sale Price | Title Company |
|---|---|---|---|
| Hom Wendy L | $960,000 | -- | |
| Hom Wendy L | $960,000 | -- | |
| Behnken 2018 Family Trust | -- | -- | |
| Behnken 2018 Family Trust | -- | -- | |
| Behnken 2017 Family Trust | -- | -- | |
| Behnken 2017 Family Trust | -- | -- |
Source: Public Records
Mortgage History
| Date | Status | Borrower | Loan Amount |
|---|---|---|---|
| Open | Hom Wendy L | $768,000 | |
| Closed | Hom Wendy L | $768,000 |
Source: Public Records
Tax History Compared to Growth
Tax History
| Year | Tax Paid | Tax Assessment Tax Assessment Total Assessment is a certain percentage of the fair market value that is determined by local assessors to be the total taxable value of land and additions on the property. | Land | Improvement |
|---|---|---|---|---|
| 2025 | $10,436 | $55,078 | $13,212 | $41,866 |
| 2024 | $10,436 | $51,960 | $16,897 | $35,063 |
| 2023 | $10,854 | $55,440 | $15,288 | $40,152 |
| 2022 | $10,442 | $54,480 | $14,940 | $39,540 |
| 2021 | $10,562 | $55,620 | $14,940 | $40,680 |
| 2020 | $10,625 | $60,960 | $14,940 | $46,020 |
| 2019 | $10,118 | $57,720 | $14,940 | $42,780 |
| 2018 | $9,340 | $47,277 | $11,644 | $35,633 |
| 2017 | $8,830 | $44,788 | $13,372 | $31,416 |
| 2016 | $8,285 | $44,788 | $13,372 | $31,416 |
| 2015 | $4,876 | $42,996 | $14,128 | $28,868 |
| 2014 | $4,876 | $41,472 | $12,835 | $28,637 |
Source: Public Records
Map
Nearby Homes
- 245-12 62nd Ave Unit G/3 Lower
- 24580 61st Ave Unit 68th
- 245-48 62nd Ave Unit Upper 2/3BR
- 245-22 62nd Ave Unit Upper
- 245-38 61st Ave Unit Lower unit F2
- 24563 61st Ave
- 61- 26 245th Place Unit F-2
- 249-30 63rd Ave Unit 4-1275
- 60-19 Marathon Pkwy Unit 2-40
- 57-27 246th
- 61-15 251st St Unit 1100
- 244-89 61st Ave
- 6435 Marathon Pkwy
- 63-41 252nd St
- 252-23 63 Unit 1081
- 252-33 63rd Ave Unit Upper Level
- 57- 45 Marathon Pkwy Unit Uppr
- 251-42 61st Ave Unit 1-1149
- 251-29 61st Ave Unit 2-719
- 60-31 251st St Unit 2-814
- 245-66 63rd Ave
- 24562 63rd Ave
- 24572 63rd Ave
- 24572 63rd Ave
- 24556 63rd Ave
- 245-56 63rd Ave
- 24556 63rd Ave
- 245-58 63rd Ave
- 245-62 63rd Ave
- 24578 63rd Ave
- 245-78 63rd Ave
- 245-72 63rd Ave
- 24571 63rd Ave
- 24565 63rd Ave
- 239-28 63 Ave
- 24577 63rd Ave
- 24584 63rd Ave
- 6320 Marathon Pkwy
- 245-74 62 Ave Unit 6A
- 24561 63rd Ave