2457 Chandler Ave Unit 11 Fort Myers, FL 33907
Estimated Value: $315,907 - $335,000
4
Beds
2
Baths
1,615
Sq Ft
$200/Sq Ft
Est. Value
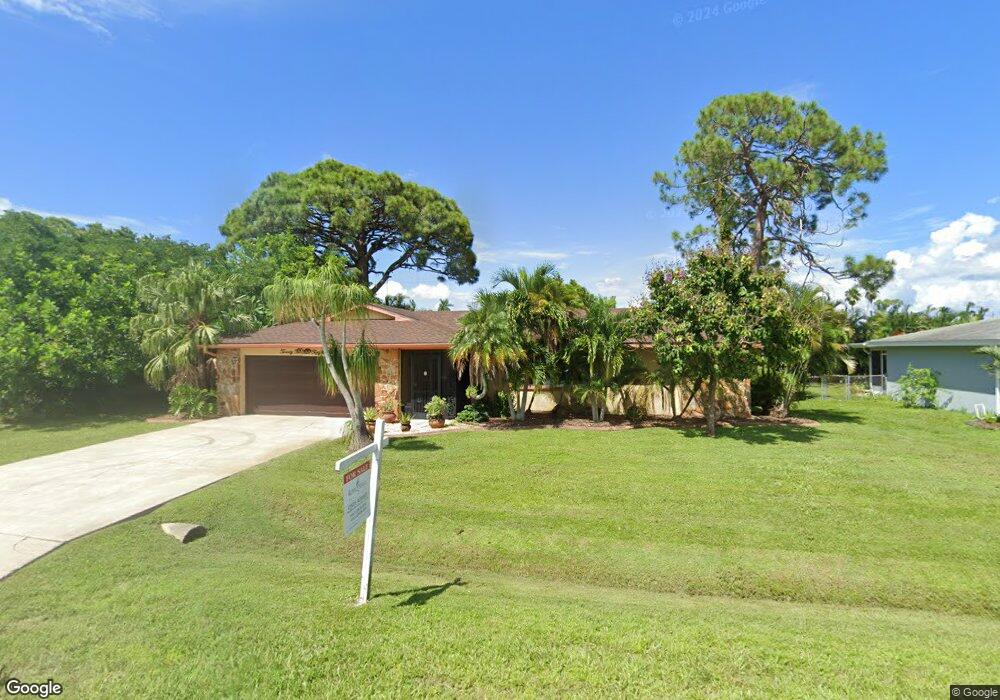
About This Home
This home is located at 2457 Chandler Ave Unit 11, Fort Myers, FL 33907 and is currently estimated at $322,977, approximately $199 per square foot. 2457 Chandler Ave Unit 11 is a home located in Lee County with nearby schools including Orangewood Elementary School, Allen Park Elementary School, and Edison Park Creative & Expressive Arts School.
Ownership History
Date
Name
Owned For
Owner Type
Purchase Details
Closed on
Apr 16, 2025
Sold by
Lori Kay Hudson Revocable Trust and Sinclair Mary
Bought by
Mark Chase Living Trust and Chase
Current Estimated Value
Purchase Details
Closed on
Jan 25, 2021
Sold by
Hudson Lori Kay
Bought by
Hudson Lori Kay and Lori Kay Hudson Revocable Trus
Purchase Details
Closed on
Nov 22, 2020
Sold by
Hudson Lori Kay
Bought by
Hudson Lori Kay
Purchase Details
Closed on
Jun 5, 2017
Sold by
Hudson Lori Kay
Bought by
Hudson Lori Kay and Davis Brian Lee
Purchase Details
Closed on
May 22, 2012
Sold by
Ciuffetelli Lori Kay and Hudson Lori Kay
Bought by
Hudson Lori Kay
Purchase Details
Closed on
Oct 22, 1999
Sold by
Adams Janet P
Bought by
Ciuffetelli Lori Kay
Home Financials for this Owner
Home Financials are based on the most recent Mortgage that was taken out on this home.
Original Mortgage
$89,550
Interest Rate
7.91%
Create a Home Valuation Report for This Property
The Home Valuation Report is an in-depth analysis detailing your home's value as well as a comparison with similar homes in the area
Home Values in the Area
Average Home Value in this Area
Purchase History
| Date | Buyer | Sale Price | Title Company |
|---|---|---|---|
| Mark Chase Living Trust | $330,000 | Victory Title | |
| Hudson Lori Kay | -- | Accommodation | |
| Hudson Lori Kay | -- | Attorney | |
| Hudson Lori Kay | -- | Attorney | |
| Hudson Lori Kay | -- | Uptown Title Llc | |
| Ciuffetelli Lori Kay | $99,500 | -- |
Source: Public Records
Mortgage History
| Date | Status | Borrower | Loan Amount |
|---|---|---|---|
| Previous Owner | Ciuffetelli Lori Kay | $89,550 |
Source: Public Records
Tax History Compared to Growth
Tax History
| Year | Tax Paid | Tax Assessment Tax Assessment Total Assessment is a certain percentage of the fair market value that is determined by local assessors to be the total taxable value of land and additions on the property. | Land | Improvement |
|---|---|---|---|---|
| 2025 | $1,221 | $333,231 | $119,510 | $202,798 |
| 2024 | $1,221 | $105,795 | -- | -- |
| 2023 | $1,173 | $102,714 | $0 | $0 |
| 2022 | $1,273 | $99,722 | $0 | $0 |
| 2021 | $1,210 | $186,779 | $39,788 | $146,991 |
| 2020 | $1,206 | $95,480 | $0 | $0 |
| 2019 | $1,171 | $93,333 | $0 | $0 |
| 2018 | $1,166 | $91,593 | $0 | $0 |
| 2017 | $1,149 | $89,709 | $0 | $0 |
| 2016 | $1,133 | $140,051 | $30,990 | $109,061 |
| 2015 | $1,136 | $119,199 | $30,795 | $88,404 |
| 2014 | -- | $114,494 | $18,841 | $95,653 |
| 2013 | -- | $121,408 | $11,017 | $110,391 |
Source: Public Records
Map
Nearby Homes
- 2342 Dover Ave
- 2362 Harvard Ave
- 2273 Crystal Dr
- 2254 Crystal Dr
- 5870 Trailwinds Dr Unit 614
- 2225 Aldridge Ave
- 5530 Trailwinds Dr Unit 712
- 5650 Trailwinds Dr Unit 124
- 5650 Trailwinds Dr Unit 111
- 6441 Emerald Pines Cir
- 6265 Mark Ln
- 8649 Flores Ct
- 8600 Granada Ct
- 5585 Trailwinds Dr Unit 326
- 5585 Trailwinds Dr Unit 314
- 6180 E Pine Pkwy
- 5970 Trailwinds Dr Unit 111
- 2148 Dover Ave
- 5625 Trailwinds Dr Unit 412
- 5765 Trailwinds Dr Unit 115
- 2461 Chandler Ave
- 2454 Burton Ave
- 2448 Burton Ave
- 2460 Burton Ave
- 2443 Chandler Ave
- 2456 Chandler Ave
- 2442 Burton Ave
- 2460 Chandler Ave
- 2448 Chandler Ave
- 2437 Chandler Ave Unit 2B
- 2437 Chandler Ave
- 2442 Chandler Ave
- 8626 Fordham St
- 8636 Fordham St
- 2436 Burton Ave
- 2449 Burton Ave
- 2461 Burton Ave Unit 2B
- 8624 Fordham St
- 8642 Fordham St