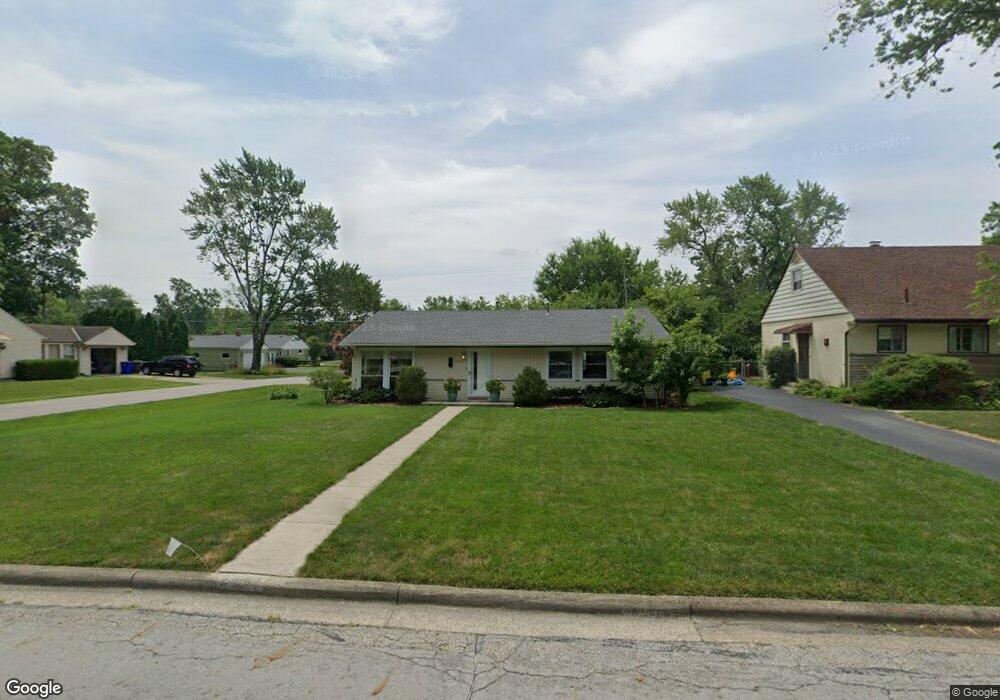
2457 Cranford Rd Columbus, OH 43221
Estimated Value: $409,000 - $434,000
3
Beds
2
Baths
1,308
Sq Ft
$323/Sq Ft
Est. Value
About This Home
This home is located at 2457 Cranford Rd, Columbus, OH 43221 and is currently estimated at $422,339, approximately $322 per square foot. 2457 Cranford Rd is a home located in Franklin County with nearby schools including Windermere Elementary School, Hastings Middle School, and Upper Arlington High School.
Ownership History
Date
Name
Owned For
Owner Type
Purchase Details
Closed on
May 24, 2004
Sold by
Hammond Pamela S
Bought by
Volheim Laurie J
Current Estimated Value
Home Financials for this Owner
Home Financials are based on the most recent Mortgage that was taken out on this home.
Original Mortgage
$177,219
Outstanding Balance
$85,480
Interest Rate
5.91%
Mortgage Type
FHA
Estimated Equity
$336,859
Purchase Details
Closed on
Jul 5, 1994
Sold by
Shephard Rita G
Bought by
Pamela S Hammond
Home Financials for this Owner
Home Financials are based on the most recent Mortgage that was taken out on this home.
Original Mortgage
$83,538
Interest Rate
8.66%
Mortgage Type
FHA
Purchase Details
Closed on
Aug 17, 1992
Purchase Details
Closed on
Nov 15, 1988
Create a Home Valuation Report for This Property
The Home Valuation Report is an in-depth analysis detailing your home's value as well as a comparison with similar homes in the area
Home Values in the Area
Average Home Value in this Area
Purchase History
| Date | Buyer | Sale Price | Title Company |
|---|---|---|---|
| Volheim Laurie J | $180,000 | -- | |
| Pamela S Hammond | $85,500 | -- | |
| -- | $78,000 | -- | |
| -- | $67,200 | -- |
Source: Public Records
Mortgage History
| Date | Status | Borrower | Loan Amount |
|---|---|---|---|
| Open | Volheim Laurie J | $177,219 | |
| Previous Owner | Pamela S Hammond | $83,538 |
Source: Public Records
Tax History Compared to Growth
Tax History
| Year | Tax Paid | Tax Assessment Tax Assessment Total Assessment is a certain percentage of the fair market value that is determined by local assessors to be the total taxable value of land and additions on the property. | Land | Improvement |
|---|---|---|---|---|
| 2024 | $7,096 | $117,710 | $52,050 | $65,660 |
| 2023 | $6,206 | $117,710 | $52,050 | $65,660 |
| 2022 | $6,098 | $96,010 | $37,490 | $58,520 |
| 2021 | $5,398 | $96,010 | $37,490 | $58,520 |
| 2020 | $5,886 | $96,010 | $37,490 | $58,520 |
| 2019 | $5,525 | $79,670 | $37,490 | $42,180 |
| 2018 | $4,920 | $79,670 | $37,490 | $42,180 |
| 2017 | $5,482 | $79,670 | $37,490 | $42,180 |
| 2016 | $4,351 | $65,810 | $30,000 | $35,810 |
| 2015 | $4,348 | $65,810 | $30,000 | $35,810 |
| 2014 | $4,352 | $65,810 | $30,000 | $35,810 |
| 2013 | $2,078 | $59,815 | $27,265 | $32,550 |
Source: Public Records
Map
Nearby Homes
- 2424 Nottingham Rd
- 2401 Shrewsbury Rd
- 2413 Edgevale Rd
- 2565 Nottingham Rd
- 2308 Shrewsbury Rd
- 2666 Shrewsbury Rd
- 2527 Wickliffe Rd
- 2680 Bristol Rd
- 2714 Woodstock Rd
- 2195 Edgevale Rd
- 2745 Cranford Rd
- 2300 Hoxton Ct
- 2544 Zollinger Rd
- 2276 Hoxton Ct
- 2162 Oakmount Rd
- 3920 Overdale Dr
- 2370 Zollinger Rd
- 2081 Fishinger Rd
- 3918 Hillview Dr
- 3163 S Dorchester Rd
- 2465 Cranford Rd
- 2439 Cranford Rd
- 2471 Cranford Rd
- 2464 Shrewsbury Rd
- 2472 Shrewsbury Rd
- 2448 Shrewsbury Rd
- 2454 Cranford Rd
- 2480 Shrewsbury Rd
- 2479 Cranford Rd
- 2462 Cranford Rd
- 2429 Cranford Rd
- 2436 Cranford Rd
- 2470 Cranford Rd
- 2488 Shrewsbury Rd
- 2438 Shrewsbury Rd
- 2487 Cranford Rd
- 2421 Cranford Rd
- 2478 Cranford Rd
- 2426 Cranford Rd
- 2496 Shrewsbury Rd